予習シリーズ6年算数Pythonプログラム教材


和と差の文章題 第1回
例1
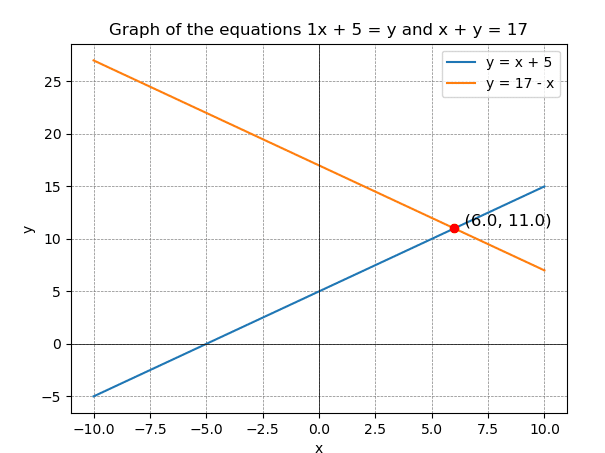
x+5=y
x+y=17匹
import numpy as np
import matplotlib.pyplot as plt

# 行列とベクトルを定義
A = np.array([[1, -1], [1, 1]])
b = np.array([-5, 17])

# 逆行列を使って解を求める
x, y = np.linalg.solve(A, b)

print(f"Solution: x = {x}, y = {y}")

# グラフの描画
x_values = np.linspace(-10, 10, 400)
y1_values = x_values + 5
y2_values = 17 - x_values

plt.plot(x_values, y1_values, label="y = x + 5")
plt.plot(x_values, y2_values, label="y = 17 - x")

# 解をプロット
plt.scatter(x, y, color='red', zorder=5)
plt.text(x, y, f"  ({x}, {y})", fontsize=12, verticalalignment='bottom')

plt.axhline(0, color='black',linewidth=0.5)
plt.axvline(0, color='black',linewidth=0.5)
plt.grid(color = 'gray', linestyle = '--', linewidth = 0.5)

plt.legend()
plt.xlabel('x')
plt.ylabel('y')
plt.title('Graph of the equations 1x + 5 = y and x + y = 17')
plt.show()
例2
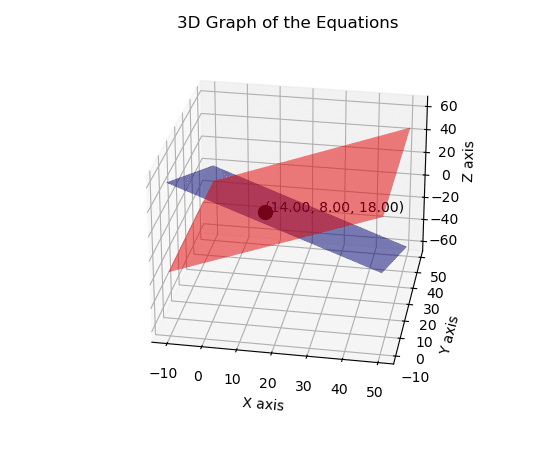
y+6=x
x+4=z
x+y+z=40人
import numpy as np
import matplotlib.pyplot as plt
from mpl_toolkits.mplot3d import Axes3D

# Define the matrix and vector
A = np.array([[-1, 1, 0],
              [1, 0, -1],
              [1, 1, 1]])
b = np.array([-6, -4, 40])

# Solve for x, y, z
solution = np.linalg.solve(A, b)
x, y, z = solution

print(f"Solution: x = {x}, y = {y}, z = {z}")

# Plotting the solution
fig = plt.figure()
ax = fig.add_subplot(111, projection='3d')

# Define the range for x and y
x_values = np.linspace(-10, 50, 100)
y_values = np.linspace(-10, 50, 100)
X, Y = np.meshgrid(x_values, y_values)

# Define the planes for the equations
Z1 = X - 4  # z = x + 4
Z2 = 40 - X - Y  # x + y + z = 40

# Plot the planes
ax.plot_surface(X, Y, Z1, alpha=0.5, rstride=100, cstride=100, color='red', label='x + 4 = z')
ax.plot_surface(X, Y, Z2, alpha=0.5, rstride=100, cstride=100, color='blue', label='x + y + z = 40')

# Plot the solution point
ax.scatter(x, y, z, color='black', s=100)
ax.text(x, y, z, f"({x:.2f}, {y:.2f}, {z:.2f})", color='black')

# Set labels
ax.set_xlabel('X axis')
ax.set_ylabel('Y axis')
ax.set_zlabel('Z axis')
plt.title('3D Graph of the Equations')

plt.show()
例3
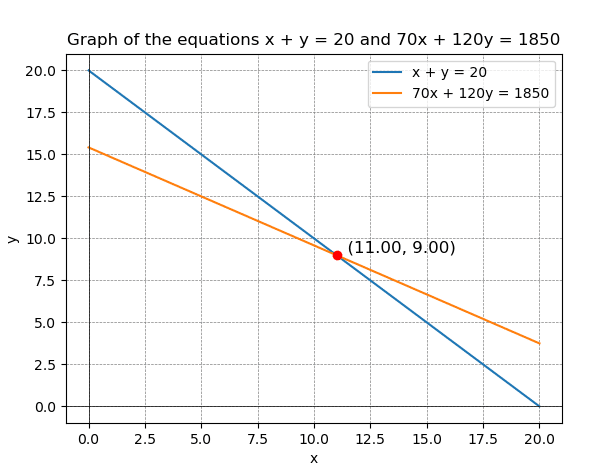
x+y=20個
70x+120y=1850人
import numpy as np
import matplotlib.pyplot as plt

# Define the matrix and vector
A = np.array([[1, 1],
              [70, 120]])
b = np.array([20, 1850])

# Solve for x and y using the inverse of A
solution = np.linalg.solve(A, b)
x, y = solution

print(f"Solution: x = {x}, y = {y}")

# Define the range for plotting
x_values = np.linspace(0, 20, 400)
y1_values = 20 - x_values
y2_values = (1850 - 70 * x_values) / 120

# Plot the equations
plt.plot(x_values, y1_values, label='x + y = 20')
plt.plot(x_values, y2_values, label='70x + 120y = 1850')

# Plot the solution point
plt.scatter(x, y, color='red', zorder=5)
plt.text(x, y, f"  ({x:.2f}, {y:.2f})", fontsize=12, verticalalignment='bottom')

# Set up the plot
plt.axhline(0, color='black', linewidth=0.5)
plt.axvline(0, color='black', linewidth=0.5)
plt.grid(color='gray', linestyle='--', linewidth=0.5)
plt.legend()
plt.xlabel('x')
plt.ylabel('y')
plt.title('Graph of the equations x + y = 20 and 70x + 120y = 1850')
plt.show()
例4
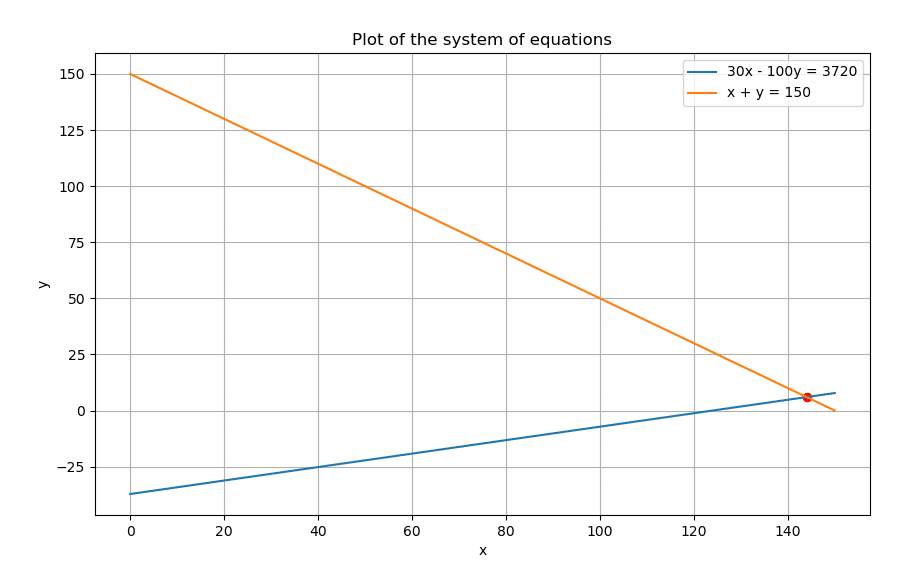
30x-100y=3720円
x+y=150枚
import numpy as np
import matplotlib.pyplot as plt

# Define the equations
# 1. 30x - 100y = 3720
# 2. x + y = 150

# Rewriting the equations in the form y = mx + b
# For 30x - 100y = 3720 => y = (30/100)x - 3720/100
def line1(x):
    return (30/100)*x - 3720/100

# For x + y = 150 => y = -x + 150
def line2(x):
    return -x + 150

# Define the x values for which you want to plot the lines
x = np.linspace(0, 150, 400)

# Calculate the y values for each line
y1 = line1(x)
y2 = line2(x)

# Plot the lines
plt.figure(figsize=(10, 6))
plt.plot(x, y1, label='30x - 100y = 3720')
plt.plot(x, y2, label='x + y = 150')

# Calculate the intersection point
A = np.array([[30, -100], [1, 1]])
B = np.array([3720, 150])
intersection = np.linalg.solve(A, B)

plt.scatter(*intersection, color='red')  # Plot the intersection point

# Add labels and legend
plt.xlabel('x')
plt.ylabel('y')
plt.title('Plot of the system of equations')
plt.legend()
plt.grid(True)

# Show the plot
plt.show()

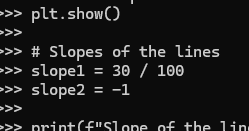
# Slopes of the lines
slope1 = 30 / 100
slope2 = -1

print(f"Slope of the line 30x - 100y = 3720: {slope1}")
print(f"Slope of the line x + y = 150: {slope2}")
例8
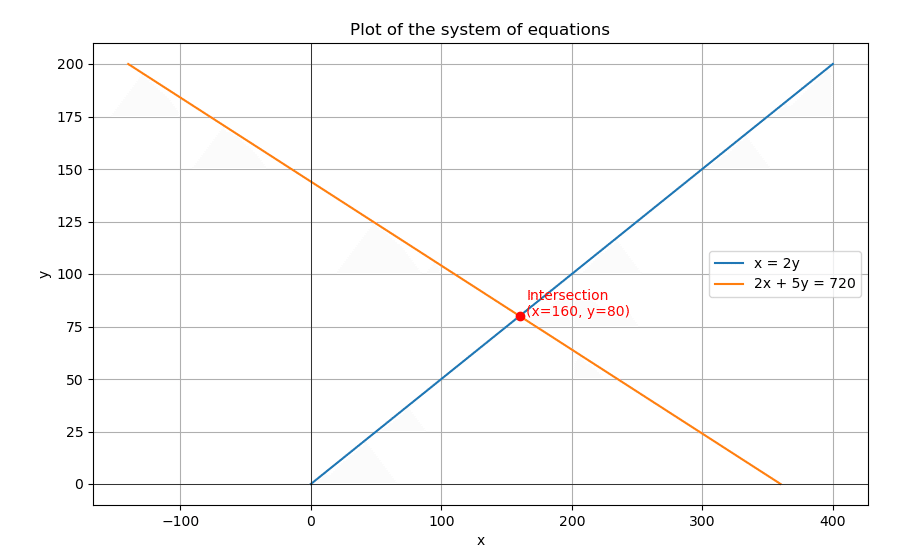
x=2y
2x+5y=720円
import numpy as np
import matplotlib.pyplot as plt

# Define the range for y
y = np.linspace(0, 200, 400)

# Define the equations
x1 = 2 * y
x2 = (720 - 5 * y) / 2

# Plot the equations
plt.figure(figsize=(10, 6))
plt.plot(x1, y, label='x = 2y')
plt.plot(x2, y, label='2x + 5y = 720')

# Calculate the intersection point
y_intersect = 80  # from solving the system manually or with another method
x_intersect = 2 * y_intersect

# Plot the intersection point
plt.plot(x_intersect, y_intersect, 'ro')  # red dot
plt.text(x_intersect + 5, y_intersect, f'Intersection\n(x={x_intersect}, y={y_intersect})', color='red')

# Labels and title
plt.xlabel('x')
plt.ylabel('y')
plt.title('Plot of the system of equations')
plt.legend()
plt.grid(True)
plt.axhline(0, color='black',linewidth=0.5)
plt.axvline(0, color='black',linewidth=0.5)
plt.show()
例19
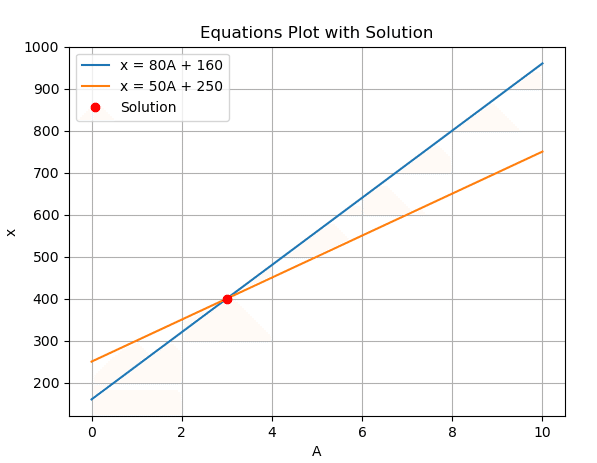
x=80A+160円
x=50A+250円
import numpy as np
import matplotlib.pyplot as plt
from sympy import symbols, solve

# Define variables
A, x = symbols('A x')

# Define equations
eq1 = x - 80*A - 160
eq2 = x - 50*A - 250

# Solve the system of equations
solution = solve((eq1, eq2), (A, x))
A_value = solution[A]
x_value = solution[x]

# Define range of A values
A_values = np.linspace(0, 10, 100)

# Define equations
def equation1(A):
    return 80*A + 160

def equation2(A):
    return 50*A + 250

# Calculate corresponding x values
x_values1 = equation1(A_values)
x_values2 = equation2(A_values)

# Plot the equations
plt.plot(A_values, x_values1, label='x = 80A + 160')
plt.plot(A_values, x_values2, label='x = 50A + 250')

# Plot the solution point
plt.plot(A_value, x_value, 'ro', label='Solution')

# Add labels and legend
plt.xlabel('A')
plt.ylabel('x')
plt.title('Equations Plot with Solution')
plt.legend()

# Show the plot
plt.grid(True)
plt.show()

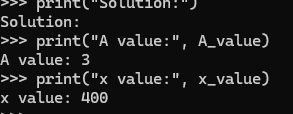
# Print the solution
print("Solution:")
print("A value:", A_value)
print("x value:", x_value)
第2回目 数の規則性
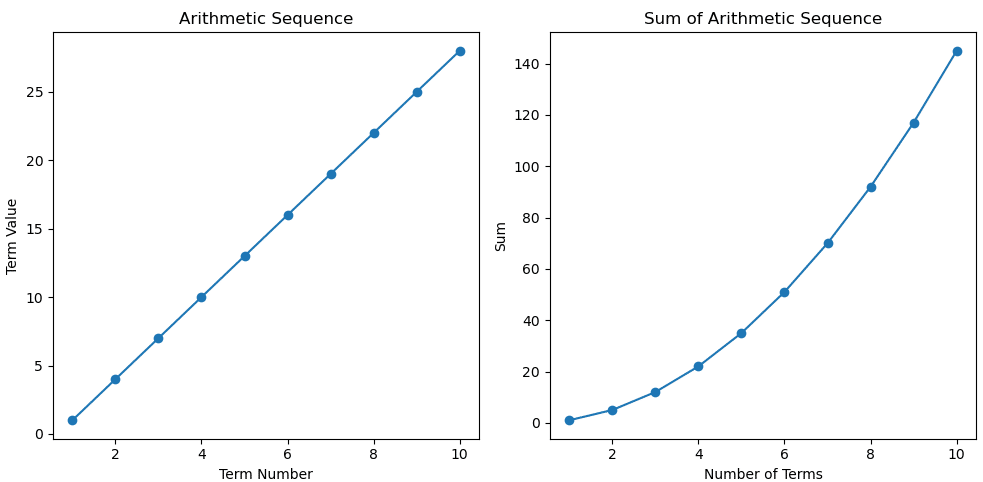
例9 等差数列
等差数列(n)=はじめの数+公差×(n-1)
等差数列の和(n)=((はじめの数+最後の数)×n)×(1/2)
import matplotlib.pyplot as plt

def arithmetic_sequence(a, d, n):
    """
    Function to generate terms of an arithmetic sequence.

    Parameters:
    a (float): First term of the sequence.
    d (float): Common difference of the sequence.
    n (int): Number of terms in the sequence.

    Returns:
    sequence (list): List of terms in the arithmetic sequence.
    """
    sequence = [a + d * (i - 1) for i in range(1, n + 1)]
    return sequence

def arithmetic_sequence_sum(a, l, n):
    """
    Function to calculate the sum of an arithmetic sequence.

    Parameters:
    a (float): First term of the sequence.
    l (float): Last term of the sequence.
    n (int): Number of terms in the sequence.

    Returns:
    sum (float): Sum of the arithmetic sequence.
    """
    return ((a + l) * n) / 2

# Specify the starting number, common difference, and number of terms
start_num = 1
common_diff = 3
num_terms = 10

# Generate the arithmetic sequence
sequence = arithmetic_sequence(start_num, common_diff, num_terms)

# Term numbers
term_numbers = list(range(1, num_terms + 1))

# Cumulative sums
sums = [arithmetic_sequence_sum(start_num, term, i) for i, term in enumerate(sequence, start=1)]

# Plotting the graphs
plt.figure(figsize=(10, 5))

# Arithmetic sequence graph
plt.subplot(1, 2, 1)
plt.plot(term_numbers, sequence, marker='o')
plt.title('Arithmetic Sequence')
plt.xlabel('Term Number')
plt.ylabel('Term Value')

# Sum graph
plt.subplot(1, 2, 2)
plt.plot(term_numbers, sums, marker='o')
plt.title('Sum of Arithmetic Sequence')
plt.xlabel('Number of Terms')
plt.ylabel('Sum')

plt.tight_layout()
plt.show()
例12
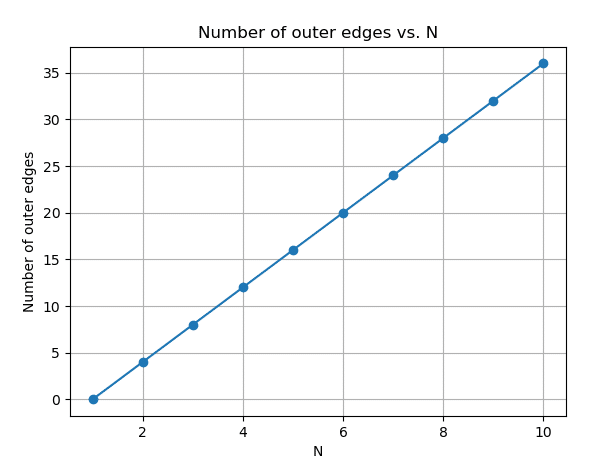
外側まわり個数=(N-1)×4個
import matplotlib.pyplot as plt

def calculate_outer_edges(N):
    # Calculate the number of outer edges using the formula (N-1) * 4
    outer_edges = (N - 1) * 4
    return outer_edges

# Example usage:
N_values = list(range(1, 11))  # Example range of N values
outer_edges_values = [calculate_outer_edges(N) for N in N_values]

# Plotting the graph
plt.plot(N_values, outer_edges_values, marker='o', linestyle='-')
plt.xlabel('N')
plt.ylabel('Number of outer edges')
plt.title('Number of outer edges vs. N')
plt.grid(True)
plt.show()
例13
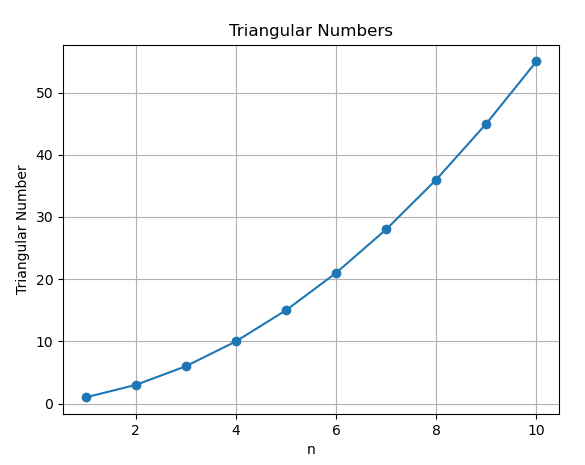
三角数=1+2+3+4…=(1/2)n(n+1)
import matplotlib.pyplot as plt

def triangular_number(n):
    return (n * (n + 1)) // 2

# Compute triangular numbers within a specified range
start = 1
end = 10
triangular_numbers = [triangular_number(n) for n in range(start, end+1)]

# Plot the computed triangular numbers
plt.plot(range(start, end+1), triangular_numbers, marker='o')
plt.title('Triangular Numbers')
plt.xlabel('n')
plt.ylabel('Triangular Number')
plt.grid(True)
plt.show()
上3回 平面図形(1)
例15
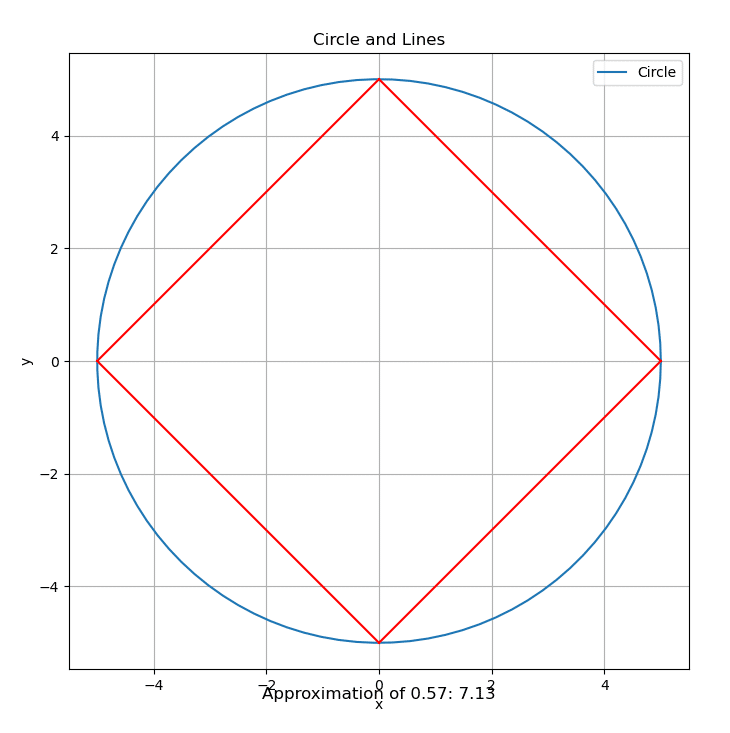
x^2+y^2=A^2
(A,0)と(0,A)を線で結ぶ、
(A,0)と(0,-A)を線で結ぶ、
(-A,0)と(0,-A)を線で結ぶ、
(-A,0)と(0,A)を線で結ぶ、
0.57公式=A×A×π×(1/4)-A×A×(1/2)
import matplotlib.pyplot as plt
import numpy as np

# Circle radius
A = 5

# Circle center
center = (0, 0)

# Equation of the circle
theta = np.linspace(0, 2*np.pi, 100)
x = A * np.cos(theta)
y = A * np.sin(theta)

# Coordinates of the lines
lines = [
    [(A, 0), (0, A)],
    [(0, A), (-A, 0)],
    [(-A, 0), (0, -A)],
    [(0, -A), (A, 0)]
]

# Plot
plt.figure(figsize=(8, 8))
plt.plot(x, y, label='Circle')
for line in lines:
    plt.plot([line[0][0], line[1][0]], [line[0][1], line[1][1]], 'r')

# Calculation of the approximation for 0.57
approximation = A * A * np.pi * (1/4) - A * A * (1/2)
plt.text(0, -6, f'Approximation of 0.57: {approximation:.2f}', fontsize=12, ha='center')

# Graph settings
plt.axis('equal')
plt.xlabel('x')
plt.ylabel('y')
plt.title('Circle and Lines')
plt.grid(True)
plt.legend()
plt.show()
第4回 容器と水量・変化とグラフ
かさの体積と単位換算
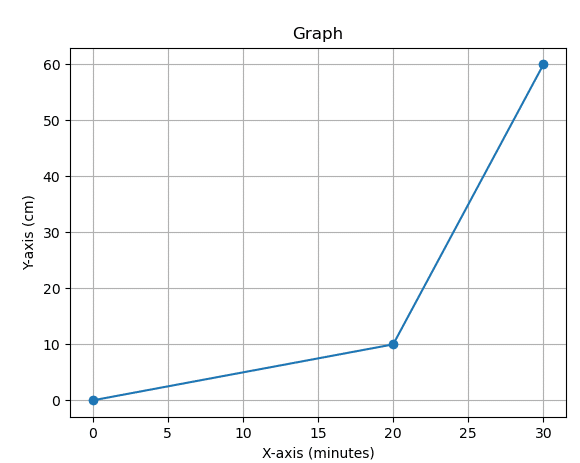
例3
横軸分 縦軸cm
(0,0)から(20,10)をひく
(20,10)から(30,60)をひく
import matplotlib.pyplot as plt

# Points on the graph
x_values = [0, 20, 30]
y_values = [0, 10, 60]

# Calculate the slope between the points (0,0) and (20,10)
slope1 = (y_values[1] - y_values[0]) / (x_values[1] - x_values[0])

# Calculate the slope between the points (20,10) and (30,60)
slope2 = (y_values[2] - y_values[1]) / (x_values[2] - x_values[1])

# Print the slopes
print("Slope between (0,0) and (20,10):", slope1)
print("Slope between (20,10) and (30,60):", slope2)

# Plotting the points
plt.plot(x_values, y_values, marker='o')

# Adding labels
plt.xlabel('X-axis (分)')
plt.ylabel('Y-axis (cm)')

# Adding title
plt.title('Graph')

# Show plot
plt.grid(True)
plt.show()
例4
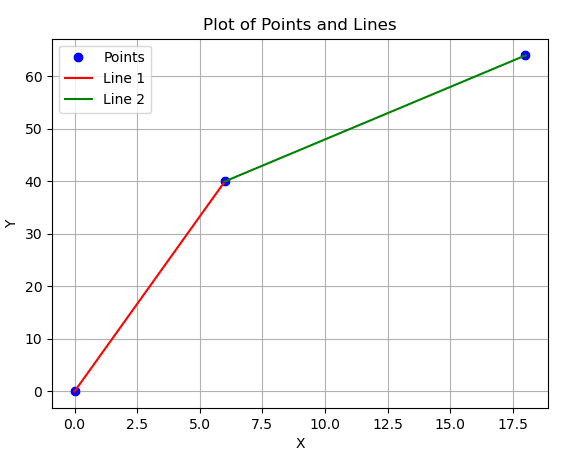
横軸分 縦軸cm
(0,0)から(6,40)をひく
(6,40)から(18,64)をひく
import matplotlib.pyplot as plt

# Coordinates of points
x1, y1 = 0, 0
x2, y2 = 6, 40
x3, y3 = 18, 64

# Plot the points
plt.plot([x1, x2, x3], [y1, y2, y3], 'bo', label='Points')

# Plot the lines
plt.plot([x1, x2], [y1, y2], 'r-', label='Line 1')
plt.plot([x2, x3], [y2, y3], 'g-', label='Line 2')

# Calculate the slopes of the lines
slope1 = (y2 - y1) / (x2 - x1)
slope2 = (y3 - y2) / (x3 - x2)

# Output the slopes of the lines
print("Slope of Line 1:", slope1)
print("Slope of Line 2:", slope2)

# Decorate the plot
plt.xlabel('X')
plt.ylabel('Y')
plt.title('Plot of Points and Lines')
plt.legend()
plt.grid(True)

# Show the plot
plt.show()

# Output the slopes of the lines
print("Slope of Line 1:", slope1)
print("Slope of Line 2:", slope2)
例8
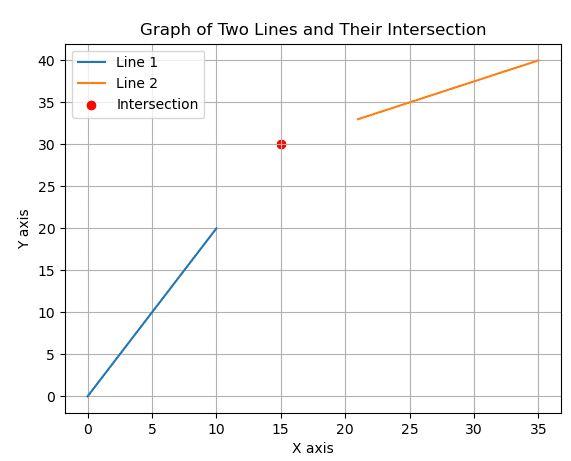
横軸分 縦軸cm
(0,0)から(10,20)をひく 傾きを求める
(21,33)から(35,40)をひく 傾きを求める
交点を求める
import matplotlib.pyplot as plt

def calculate_slope(point1, point2):
    # Calculate the slope of the line passing through the given points
    x1, y1 = point1
    x2, y2 = point2
    slope = (y2 - y1) / (x2 - x1)
    return slope

def calculate_intersection(slope1, intercept1, slope2, intercept2):
    # Calculate the intersection point of two lines
    x = (intercept2 - intercept1) / (slope1 - slope2)
    y = slope1 * x + intercept1
    return x, y

# Points for the first line
x_values1 = [0, 10]
y_values1 = [0, 20]

# Points for the second line
x_values2 = [21, 35]
y_values2 = [33, 40]

# Calculate slopes
slope1 = calculate_slope((0,0), (10,20))
slope2 = calculate_slope((21,33), (35,40))

# Calculate intercepts
intercept1 = 0
intercept2 = 33 - slope2 * 21

# Calculate intersection
intersection = calculate_intersection(slope1, intercept1, slope2, intercept2)

# Plotting
plt.plot(x_values1, y_values1, label='Line 1')
plt.plot(x_values2, y_values2, label='Line 2')
plt.scatter(*intersection, color='red', label='Intersection')
plt.xlabel('X axis')
plt.ylabel('Y axis')
plt.title('Graph of Two Lines and Their Intersection')
plt.legend()
plt.grid(True)
plt.show()
例10
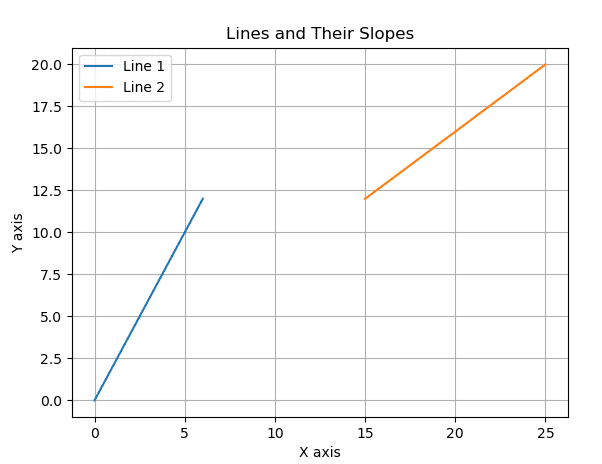
横軸分 縦軸cm
(0,0)から(6,12)をひく
(15,12)から(25,20)をひく
import matplotlib.pyplot as plt

# First line: Points (0, 0) and (6, 12)
x1 = 0
y1 = 0
x2 = 6
y2 = 12

# Calculate slope for the first line
slope1 = (y2 - y1) / (x2 - x1)

# Second line: Points (15, 12) and (25, 20)
x3 = 15
y3 = 12
x4 = 25
y4 = 20

# Calculate slope for the second line
slope2 = (y4 - y3) / (x4 - x3)

# Plotting the lines
plt.plot([x1, x2], [y1, y2], label='Line 1')  # Plotting the first line
plt.plot([x3, x4], [y3, y4], label='Line 2')  # Plotting the second line
plt.xlabel('X axis')  # Labeling x-axis
plt.ylabel('Y axis')  # Labeling y-axis
plt.title('Lines and Their Slopes')  # Adding a title to the plot
plt.legend()  # Adding legend to the plot
plt.grid(True)  # Adding grid to the plot
plt.show()  # Display the plot

# Output the slopes
print("Slope of the first line:", slope1)
print("Slope of the second line:", slope2)
第6回 速さ(1)
(60×60)/1000=3.6km/時
例3
平均の速さ=道のりの合計÷かかった時間合計
例8
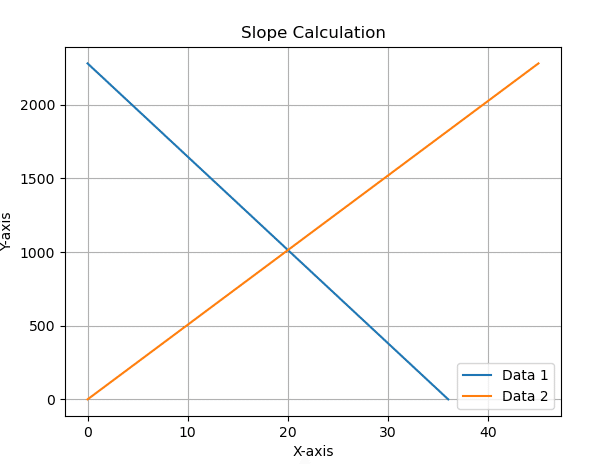
横軸分 縦軸m
(0,2280)から(36,0)
(0,0)から(45,2280)
import matplotlib.pyplot as plt

# Coordinates for the first dataset
x1 = [0, 36]
y1 = [2280, 0]

# Coordinates for the second dataset
x2 = [0, 45]
y2 = [0, 2280]

# Plot the graphs
plt.plot(x1, y1, label='Data 1')
plt.plot(x2, y2, label='Data 2')

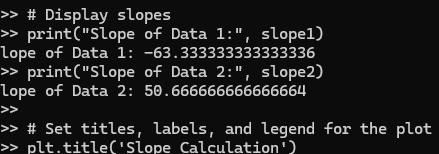
# Calculate slopes
slope1 = (y1[1] - y1[0]) / (x1[1] - x1[0])
slope2 = (y2[1] - y2[0]) / (x2[1] - x2[0])

# Display slopes
print("Slope of Data 1:", slope1)
print("Slope of Data 2:", slope2)

# Set titles, labels, and legend for the plot
plt.title('Slope Calculation')
plt.xlabel('X-axis')
plt.ylabel('Y-axis')
plt.legend()

# Display grid
plt.grid(True)

# Show the plot
plt.show()
横軸分 縦軸m
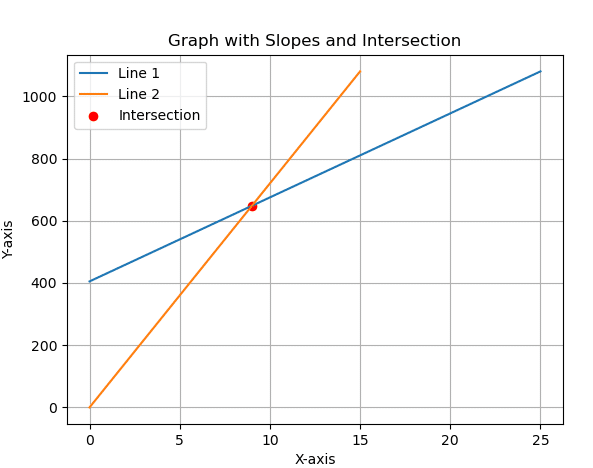
(0,405)から(25,1080) 線を引く
(0,0)から(15,1080) 線を引く
交点を求める
import matplotlib.pyplot as plt

# Data points
x1 = [0, 25]
y1 = [405, 1080]

x2 = [0, 15]
y2 = [0, 1080]

# Plot
plt.plot(x1, y1, label='Line 1')
plt.plot(x2, y2, label='Line 2')

# Calculate intersection
# First, find equations of the two lines
# y = mx + c
m1 = (y1[1] - y1[0]) / (x1[1] - x1[0])  # Slope of Line 1
c1 = y1[0] - m1 * x1[0]  # y-intercept of Line 1

m2 = (y2[1] - y2[0]) / (x2[1] - x2[0])  # Slope of Line 2
c2 = y2[0] - m2 * x2[0]  # y-intercept of Line 2

# Intersection x-coordinate
intersection_x = (c2 - c1) / (m1 - m2)
# Intersection y-coordinate
intersection_y = m1 * intersection_x + c1

# Plot intersection
plt.scatter(intersection_x, intersection_y, color='red', label='Intersection')

# Graph decoration
plt.xlabel('X-axis')
plt.ylabel('Y-axis')
plt.title('Graph with Slopes and Intersection')
plt.legend()
plt.grid(True)

# Display graph
plt.show()

# Output intersection coordinates
print(f"Intersection point coordinates: ({intersection_x}, {intersection_y})")
第8回 場合の数
n!と
組み合わせ
import math

def factorial(n):
    return math.factorial(n)

def combination(n, r):
    return math.comb(n, r)

# Example: Calculate factorial of 5
print("Factorial of 5:", factorial(5))

# Example: Calculate combinations of choosing 3 from 10
print("Combination of 10 choose 3:", combination(10, 3))
第10回 割合と比の文章題
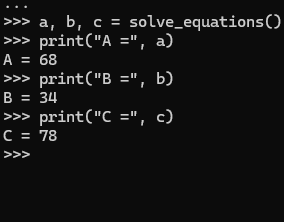
A+B+C=180°
2B=A
A+10°=C
def solve_equations():
    for a in range(1, 180):
        for b in range(1, 90):  # B cannot be greater than 90 as per the equation 2B = A
            c = 180 - a - b
            if 2 * b == a and a + 10 == c:
                return a, b, c

a, b, c = solve_equations()
print("A =", a)
print("B =", b)
print("C =", c)
第12回 平面図形(3)
センターラインの長さ÷円周
第13回 数と規則性(2)
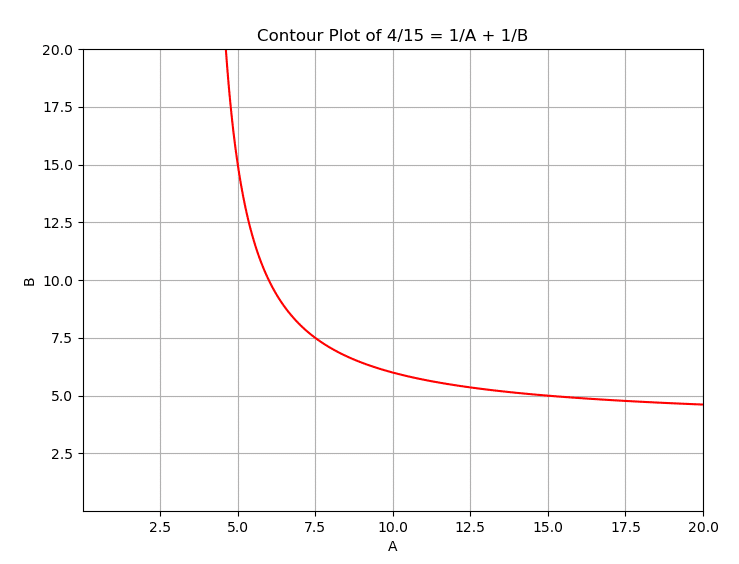
4/15=1/A+1/B
import matplotlib.pyplot as plt
import numpy as np

# Define a wider range for A and B
A_range = np.linspace(0.01, 20, 800)
B_range = np.linspace(0.01, 20, 800)

# Calculate corresponding values for 4/15
X, Y = np.meshgrid(A_range, B_range)
Z = 1 / X + 1 / Y

# Plot the contour plot
plt.figure(figsize=(8, 6))
plt.contour(X, Y, Z, levels=[4/15], colors='r', linestyles='solid')
plt.xlabel('A')
plt.ylabel('B')
plt.title('Contour Plot of 4/15 = 1/A + 1/B')
plt.grid(True)
plt.show()
第17回 論理 数の操作
10進数を2進数
2進数を10進数
補足
ビット(bit)とバイト(Byte)
def decimal_to_binary(decimal_num):
    return bin(decimal_num)[2:]

def binary_to_decimal(binary_num):
    return int(binary_num, 2)

def bits_to_bytes(bits):
    return bits / 8

def bytes_to_bits(bytes):
    return bytes * 8

# Converting decimal to binary
decimal_num = 10
binary_num = decimal_to_binary(decimal_num)
print(f"The binary representation of {decimal_num} is: {binary_num}")

# Converting binary to decimal
binary_num = '1010'
decimal_num = binary_to_decimal(binary_num)
print(f"The decimal representation of {binary_num} is: {decimal_num}")

# Converting bits to bytes
bits = 16
bytes = bits_to_bytes(bits)
print(f"{bits} bits is equal to {bytes} bytes")

# Converting bytes to bits
bytes = 2
bits = bytes_to_bits(bytes)
print(f"{bytes} bytes is equal to {bits} bits")
補足
部分分数分解
1/(n(n+1))
n角形の内角和=180(n-2)
n角形の対角線本数=(n-3)n(1/2)
1からはじまるn個の奇数和=n^2
