グリッドであれこれする

このページは途中です。
processingを用います。
グリッドあれやこれや
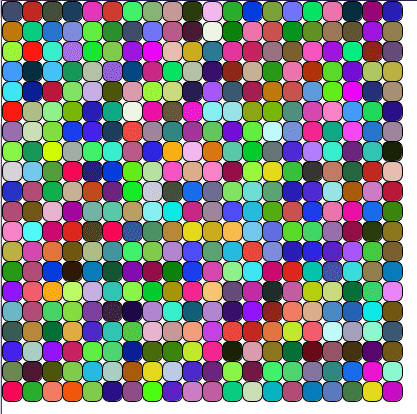
グリッドとは以下のようなものです。
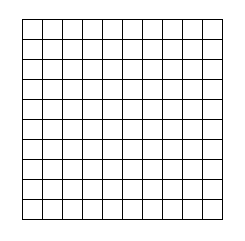
こんなようなものでもただ単純に線として描画したい場合もあればマス目として(特に色を塗ったりして)描画したい場合もあり、また交点の座標を得たい場合もあります。そこからさらに様々な加工変形を試みたい場合もあります。
単純にグリッドを構成する線の描画のみする場合(縦断横断型)
void DrawGridWH(PVector origin, float region_w, float region_h, int row_count, int col_count)
{
  float unit_w = region_w/col_count;
  float unit_h = region_h/row_count;

  //水平ラインを引く
  for(int i = 0; i<=row_count; i++)
  {
    float x0 = origin.x;
    float y0 = origin.y+unit_h*i;
    float x1 = origin.x+region_w;
    float y1 = origin.y+unit_h*i;
    line(x0,y0,x1,y1);
  }
  //垂直ラインを引く
  for(int j = 0; j<=col_count; j++)
  {
    float x0 = origin.x+unit_w*j;
    float y0 = origin.y;
    float x1 = origin.x+unit_w*j;
    float y1 = origin.y+region_h;
    line(x0,y0,x1,y1);
  }
}
int w = 200;
int h = 200;
int col_count = 10;
int row_count = 10;
DrawGridWH(new PVector(100,100),w,h,row_count,col_count);p5.jsだとだいたいこう
function setup() {
  createCanvas(400, 400);
}

function draw() {
  background(220);

  stroke(0);
  DrawGridWH(createVector(0,0),200,200,20,20);
}

function DrawGridWH(origin, region_w, region_h, row_count, col_count) {
  let unit_w = region_w / col_count;
  let unit_h = region_h / row_count;

  // 水平ラインを引く
  for (let i = 0; i <= row_count; i++) {
    let x0 = origin.x;
    let y0 = origin.y + unit_h * i;
    let x1 = origin.x + region_w;
    let y1 = origin.y + unit_h * i;
    line(x0, y0, x1, y1);
  }

  // 垂直ラインを引く
  for (let j = 0; j <= col_count; j++) {
    let x0 = origin.x + unit_w * j;
    let y0 = origin.y;
    let x1 = origin.x + unit_w * j;
    let y1 = origin.y + region_h;
    line(x0, y0, x1, y1);
  }
}
html+canvasの場合
<!DOCTYPE html>
<html>
  <head>
    <meta charset="utf-8">
    <title>DrawGridWH Example</title>
  </head>
  <body>
    <canvas id="canvas" width="400" height="400"></canvas>
    <script>
      // canvas要素の取得
      let canvas = document.getElementById('canvas');
      // 2Dコンテキストの取得
      let ctx = canvas.getContext('2d');

      // DrawGridWH関数の定義
      function DrawGridWH(origin, region_w, region_h, row_count, col_count) {
        let unit_w = region_w / col_count;
        let unit_h = region_h / row_count;

        // 水平ラインを引く
        for (let i = 0; i <= row_count; i++) {
          let x0 = origin.x;
          let y0 = origin.y + unit_h * i;
          let x1 = origin.x + region_w;
          let y1 = origin.y + unit_h * i;
          ctx.beginPath();
          ctx.moveTo(x0, y0);
          ctx.lineTo(x1, y1);
          ctx.stroke();
        }

        // 垂直ラインを引く
        for (let j = 0; j <= col_count; j++) {
          let x0 = origin.x + unit_w * j;
          let y0 = origin.y;
          let x1 = origin.x + unit_w * j;
          let y1 = origin.y + region_h;
          ctx.beginPath();
          ctx.moveTo(x0, y0);
          ctx.lineTo(x1, y1);
          ctx.stroke();
        }
      }

      // テスト用の座標を定義
      let origin = {x: 50, y: 50};
      let region_w = 300;
      let region_h = 300;
      let row_count = 10;
      let col_count = 10;

      // DrawGridWH関数を呼び出す
      DrawGridWH(origin, region_w, region_h, row_count, col_count);
    </script>
  </body>
</html>
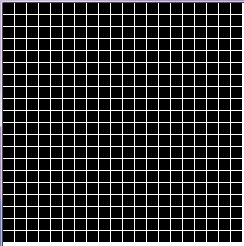
このやり方はまず大きな矩形があって、その矩形のフチに沿いながら矩形を縦断横断するように分割、そんな感じで線を描画していくやり方です。
描画する線の本数は描画されたマス目の個数より1つ多いことに注意します。マス目が10×10ならば線の本数は横11本、縦11本です。
このことはループカウントi<=col_countで調整されています。i<col_countとすると最後の線が足りません。
よくよく見てみると、上記のプログラムは『横に線を引く』関数と『縦に線を引く』関数を組み合わせてみて、たまたま格子状にあいなったとも見て取れます。言葉を変えると、『横線を縦に並べたやつ』と『縦線を横に並べたやつ』がたまたま組み合わさったともいえます。
//horizontal
void DrawGridH(PVector origin, float length, int count, float offset)
{
  //水平ライン
  for(int i = 0; i<=count; i++)
  {
    float x0 = origin.x;
    float y0 = origin.y+offset*i;
    float x1 = origin.x+length;
    float y1 = origin.y+offset*i;
    line(x0,y0,x1,y1);
  }
}

//vartical
void DrawGridV(PVector origin, float length, int count, float offset)
{
  //垂直ライン
  for(int j = 0; j<=count; j++)
  {
    float x0 = origin.x+offset*j;
    float y0 = origin.y;
    float x1 = origin.x+offset*j;
    float y1 = origin.y+length;
    line(x0,y0,x1,y1);
  }
}
void DrawGridWH2(PVector origin, float region_w, float region_h, int row_count, int col_count)
{
float unit_w = region_w/col_count;
float unit_h = region_h/row_count;
DrawGridH(origin,region_w,row_count,unit_h);
DrawGridV(origin,region_h,col_count,unit_w);
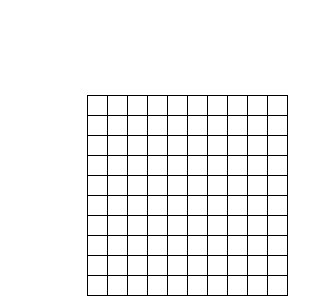
}マス目ごとに描画する場合
次に格子の交点を基準として描画する場合を考えます。
2重のループで格子の交点を移動していき、隣接する交点まで線を引くというやり方です。以下の場合、ある交点を基準として、そこから右の交点と下の交点に向かって線を引きながら基準となる交点を移動していきます。基準が右端に到達したら右の交点には線を引かず、下端に到達したら下の交点に対しては線を引きません。
void DrawGridCell(PVector origin, float region_w, float region_h, int row_count, int col_count)
{
  float unit_w = region_w/col_count;
  float unit_h = region_h/row_count;

  for(int i = 0; i<=row_count; i++)
  {
    for(int j = 0; j<=col_count; j++)
    {
      float x0 = origin.x+unit_w*j;
      float y0 = origin.y+unit_h*i;
      float x1 = origin.x+unit_w*(j+1);
      float y1 = origin.y+unit_h*(i+1);

      //水平ライン
      if(i!=row_count){line(x0,y0,x0,y1);}
      //垂直ライン
      if(j!=col_count){line(x0,y0,x1,y0);}
    }
  }
}
結果は最初のやつとかわりません。
分割と反復
最初の例では描画したい一つの巨大な領域のwidth, heightを入力として、それを任意の個数に分割するというやり方であるとみることができます。
対して2つ目の例は、まず個別のマス目の小さなwidth, heightがあって、それを指定された感覚で並べていっているものであるとみることができます。
結果としては同じになることもありますが、考え方は有用です。分割型は分割したい領域が具体的に決まっていて、そこからはみ出して欲しくない時に役立つでしょう。反復型は、ある程度自由に、なんならこちらの予想を裏切って欲しい時などに役立つでしょう。
反復型の応用例
void DrawGridCellStep(
  PVector origin,
  float cell_w, float cell_h, int row_count, int col_count, float step_h, float step_v)
{
  for(int i = 0; i<=row_count; i++)
  {
    for(int j = 0; j<=col_count; j++)
    {
      float x0 = origin.x+step_h*j;
      float y0 = origin.y+step_v*i;
      float x1 = x0+cell_w;
      float y1 = y0+cell_h;

      line(x0,y0,x0,y1);
      line(x0,y0,x1,y0);
    }
  }
}
int row_count = 10;
int col_count = 10;
float cell_w = 10;
float cell_h = 10;
float step_h = 20;
float step_v = 20;
DrawGridCellStep(new PVector(100,100),cell_w,cell_h,row_count,col_count,step_h,step_v);
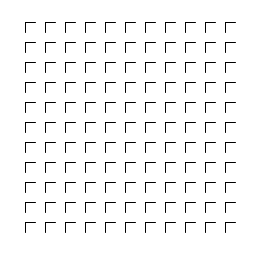
これを分割で実現しようとするとめんどくさいのが分かります。
反復型は、基準となる原点が存在する図形であれば、いかなる図形も並べることができます。
反復配置型:rect()
例えばrect関数を用いると色も塗れます。インデックスの制御がi<col_countに変わっていることにご注意ください。
void DrawGridCellRect(PVector origin, float region_w, float region_h, int row_count, int col_count)
{
  float unit_w = region_w/col_count;
  float unit_h = region_h/row_count;

  for(int i = 0; i<row_count; i++)
  {
    for(int j = 0; j<col_count; j++)
    {
      float x = origin.x+unit_w*j;
      float y = origin.y+unit_h*i;
      float w = unit_w;
      float h = unit_h;

      rect(x,y,w,h);
    }
  }
}
ここで使用しているrect()はprocessingのrect関数なので、色を塗ったりコーナーを丸めたりの自由度があります。
反復配置型:vertex()
vertex()でも同じようなことはできるでしょう。こちらは座標の計算さえできれば複雑な幾何にも対応可能です。
void DrawGridCellVertex(PVector origin, float region_w, float region_h, int row_count, int col_count)
{
  float unit_w = region_w/col_count;
  float unit_h = region_h/row_count;

  for(int i = 0; i<row_count; i++)
  {
    for(int j = 0; j<col_count; j++)
    {
      float x = origin.x+unit_w*j;
      float y = origin.y+unit_h*i;
      float w = unit_w;
      float h = unit_h;

      beginShape();
      vertex(x,y);
      vertex(x+w,y);
      vertex(x+w,y+h);
      vertex(x,y+h);
      endShape(CLOSE);
    }
  }
}
反復配置RectStep
void DrawGridRectStep(
  PVector origin,
  float unit_w, float unit_h, float step_w, float step_h, int col_count, int row_count)
{
  float x = origin.x;
  float y = origin.y;
  float w = unit_w;
  float h = unit_h;

  for(int i = 0; i<col_count; i++)
  {
    for(int j = 0; j<row_count; j++)
    {
      rect(x,y,w,h);
      x += unit_w+step_w;
    }
    x = origin.x;
    y += unit_h+step_h;
  }
} fill(0);
DrawGridRectStep(new PVector(0,0),10,10,2,2,20,20);
ディザリング
かつてディスプレイの解像度が低かった時
荒いドットと限られた色しか使えない中で
いかにして画像を滑らかに見せるかという観点から開発された技法。
簡単に言うと、うまいことドットを抜くと本来発色されてない色がなんか見えるというやつ。以下では適当に抜いているだけだが、本当はwikipediaにあるように適切なばらけ方をさせなければならない。
void DrawGridDither(
  PVector origin,
  float cell_w, float cell_h, float step_w, float step_h, int col_count, int row_count, int[] cell_flag)
{
  int m = floor(sqrt(cell_flag.length));
  float x = origin.x;
  float y = origin.y;
  float unit_w = cell_w/m;
  float unit_h = cell_h/m;

  for(int i = 0; i<col_count; i++)
  {
    for(int j = 0; j<row_count; j++)
    {
      float temp_x = x;
      float temp_y = y;
      for(int k = 0; k<m; k++)
      {
        for(int l = 0; l<m; l++)
        {
          if(cell_flag.length-1<k*m+l){continue;}
          if(cell_flag[k*m+l]>0){rect(x,y,unit_w,unit_h);}
          x += unit_w;
        }
        x = temp_x;
        y += unit_h;
      }
      x = temp_x;
      x+= cell_w+step_w;
      y = temp_y;
    }
    x = origin.x;
    y += cell_h+step_h;
  }
} fill(0);
DrawGridDither(new PVector(0,0), 10,10,0,0,30,30,new int[]{1,0,0,1});
//stroke(0)が効いている
  fill(255,0,0);
  DrawGridDither(new PVector(0,0), 4,4,0,0,300,300,new int[]{1,0,0,1});
  noStroke();
  fill(255,0,0)
;
  DrawGridDither(new PVector(0,0), 4,4,0,0,300,300,new int[]{1,0,0,1});
  noStroke();
  fill(255,0,0);
  DrawGridDither(new PVector(0,0), 4,4,0,0,300,300,new int[]{1,0,0,0});
noStroke();
fill(255,0,0);
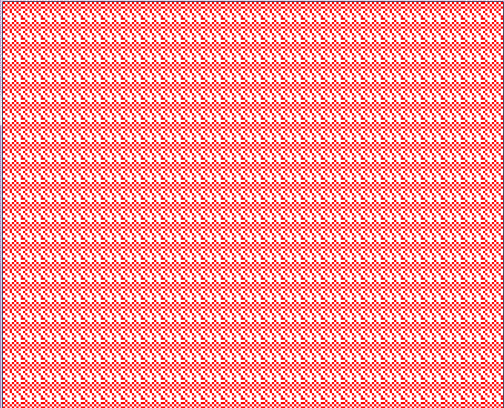
DrawGridDither(new PVector(0,0), 10,10,5,5,30,30,new int[]{1,0,1,0,1,0,1,0,1});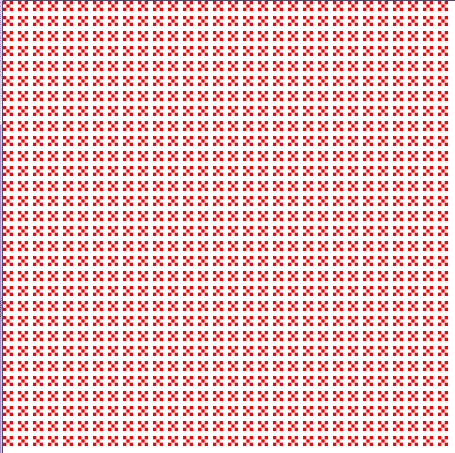
Draw内部のRectを丸めても良い
rect(x,y,unit_w,unit_h,8)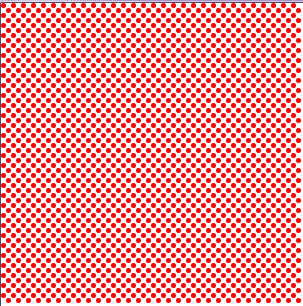
noStroke();
fill(255,0,0);
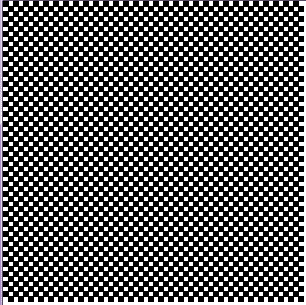
DrawGridDither(new PVector(0,0), 20,20,0,0,30,30,new int[]
{
1,0,1,0,1,0,1,0,1,
0,1,0,1,0,1,0,1,0,
1,0,1,0,1,0,1,0,1,
0,1,0,1,0,1,0,1,0,
1,0,0,1,0,0,1,0,0,
0,1,0,0,1,0,0,1,0,
0,0,1,0,0,1,0,0,1,
1,0,0,0,1,0,0,0,1,
0,1,0,0,0,1,0,0,0,
});
反復配置型:関数型インターフェース
こうした関数を抽象化していくと、Draw関数の引数に別の描画関数(関数型インターフェース)を取り込んだり、描画用のクラスを引数にとったりできます。
//関数型インターフェースの例
interface IRectDrawMethod
{
    void draw(float x, float y, float w, float h);
}

//座標毎に関数型インターフェースを実行する例
void DrawGridCellMethod(
  PVector origin,
  float region_w, float region_h,
  int row_count, int col_count,
  IRectDrawMethod method)
{
  float unit_w = region_w/col_count;
  float unit_h = region_h/row_count;

  for(int i = 0; i<row_count; i++)
  {
    for(int j = 0; j<col_count; j++)
    {
      float x = origin.x+unit_w*j;
      float y = origin.y+unit_h*i;
      float w = unit_w;
      float h = unit_h;

      method.draw(x,y,w,h);
    }
  }
}
//適当に使う方法
DrawGridCellMethod(new PVector(0,0),400,400,20,20, (x,y,w,h)->rect(x,y,w,h));円
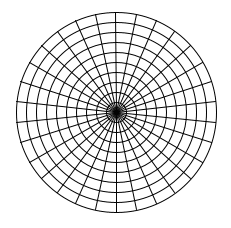
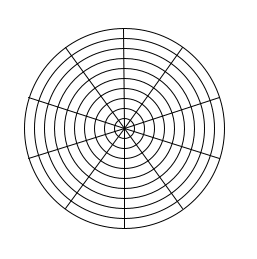
似たようなことを円でやります。
分割型の円
中心点を描画せず、最外の円を描画する必要があるため、インデックスは全体的に+1されてfor(int i = 1; i<=radius_count; i++)となります。
放射状の線は最初の線と最後の線が一致する、最後の線を描画する必要がないと考えるならインデックスは i<angle_countです。扇形を描画したいのであればインデックスは i<=angle_countとなることでしょう。
マス目を区切っている線の数と、マス目の個数はズレることもあれば一致することもあるということです。それは結局グリッドの形状によります。また、反復型はあんまり気にしなくてよいものです。
また、processingのcircle関数を用いているため、noFill()などで塗り潰しを制御する必要があります。塗りたい場合はcircle関数のループを逆転させる必要があります。
void DrawCircleGrid(PVector origin, float region_radius, int radius_count, int angle_count)
{
  float unit_radius = region_radius/radius_count;
  float unit_radian = 2*PI/angle_count;

  //円
  for(int i = 1; i<=radius_count; i++)
  {
    circle(origin.x,origin.y,2*unit_radius*i);
  }

  //放射状の線
  for(int i = 0; i<angle_count; i++)
  {
    float x0 = origin.x;
    float y0 = origin.y;
    float x1 = origin.x+region_radius*sin(unit_radian*i);
    float y1 = origin.y+region_radius*cos(unit_radian*i);
    line(x0,y0,x1,y1);
  }
}
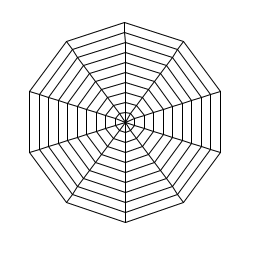
反復型の円
矩形の時と似た感じで、基準点をズラしながら描画してみましょう。
矩形の時とは異なり、露骨に結果が異なります。
void DrawRadialGrid(PVector origin, float region_radius, int radius_count, int angle_count)
{
  float unit_radius = region_radius/radius_count;
  float unit_radian = 2*PI/angle_count;

  for(int i = 1; i<=radius_count; i++)
  {
    for(int j = 0; j<angle_count; j++)
    {
      float x0 = origin.x+(unit_radius*i)*sin(unit_radian*j);
      float y0 = origin.y+(unit_radius*i)*cos(unit_radian*j);
      float xr = origin.x+(unit_radius*i)*sin(unit_radian*(j+1));
      float yr = origin.y+(unit_radius*i)*cos(unit_radian*(j+1));
      float xc = origin.x+(unit_radius*(i-1))*sin(unit_radian*j);
      float yc = origin.y+(unit_radius*(i-1))*cos(unit_radian*j);

      line(x0,y0,xr,yr);
      line(x0,y0,xc,yc);
    }
  }
}
適当な応用
せっかくなので適当な関数を用いて遊んでみます。
void DrawRadialGridRect(PVector origin, float region_radius, int radius_count, int angle_count)
{
  float unit_radius = region_radius/radius_count;
  float unit_radian = 2*PI/angle_count;

  for(int i = 1; i<=radius_count; i++)
  {
    for(int j = 0; j<angle_count; j++)
    {
      float x0 = origin.x+(unit_radius*i)*sin(unit_radian*j);
      float y0 = origin.y+(unit_radius*i)*cos(unit_radian*j);
      float xr = origin.x+(unit_radius*i)*sin(unit_radian*(j+1));
      float yr = origin.y+(unit_radius*i)*cos(unit_radian*(j+1));
      float xc = origin.x+(unit_radius*(i-1))*sin(unit_radian*j);
      float yc = origin.y+(unit_radius*(i-1))*cos(unit_radian*j);

      rect(x0,y0,xr-x0,yr-y0);

    }
  }
}
noFill();
DrawRadialGridRect(new PVector(250,250),100,10,10);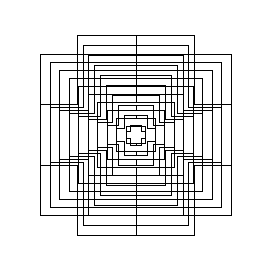
  noFill();
  DrawRadialGridRect(new PVector(250,250),100,10,100);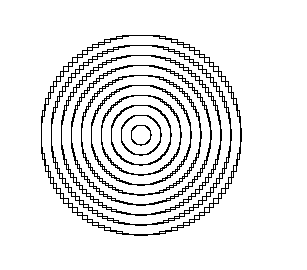
DrawRadialGridRect(new PVector(250,250),200,100,100);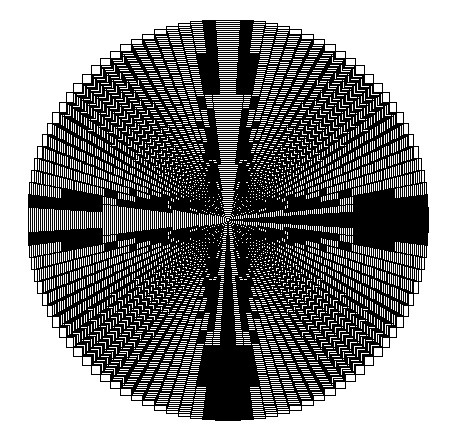
並べる
グリッドというものは『横線を縦に並べたやつ』と『縦線を横に並べたやつ』がたまたま組み合わさったと見ることもできますし、『横線と縦線の交点に着目したもの』と見ることもできます。
また、円と放射線でも似たようなことを考えることができ、この場合横線を丸めたものが円だと考えるなら、やってることは縦線横線グリッドと大差ないわけです。
並べる奴と並べる奴を組み合わせるとグリッドになるのだから、並べる奴そのものに着目することは有意義なことです。
横線を横に並べる
strokeWeightはノイズに応じる。
void DrawAlignHNoiseW(PVector origin, float unit_length, int count, float min, float max)
{
  var prev = this.getGraphics().strokeWeight;

  var x = origin.x;
  var y = origin.y;
  for(int i = 0; i<count; i++)
  {
    var weight = (min+(max-min)*noise(i));
    strokeWeight(weight);
    line(x,y,x+unit_length,y);
    x+=unit_length;
  }
  strokeWeight(prev);
}DrawAlignHNoiseW(new PVector(10,250),10,50,1,100);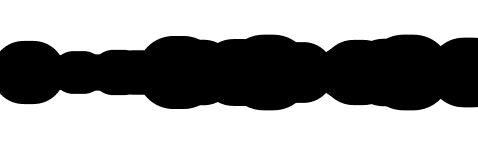
DrawAlignHNoiseW(new PVector(10,250),20,30,1,50);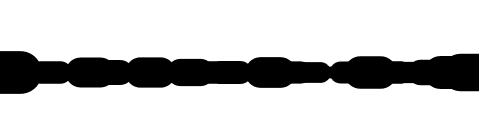
  strokeCap(SQUARE);
  DrawAlignHNoiseW(new PVector(10,250),20,30,1,50);
  strokeCap(SQUARE);
  DrawAlignHNoiseW(new PVector(10,250),2,500,15,100);
ノイズを調整したもの
var weight = (min+(max-min)*noise(i*0.01)); strokeCap(SQUARE);
DrawAlignHNoiseW(new PVector(10,250),1,500,1,50);
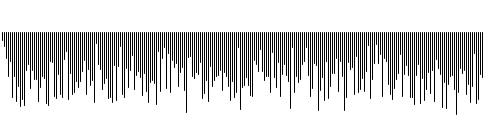
縦線を横に並べる
void DrawAlignVNoiseL(PVector origin, float h_offset, int count, float min, float max)
{
  var x = origin.x;
  var y = origin.y;
  for(int i = 0; i<count; i++)
  {
    var length = (min+(max-min)*noise(i));
    line(x,y,x,y+length);
    x+=h_offset;
  }
}
パラメータ全部のせ
void DrawAlignVNoiseWLO(
  PVector origin, int count,
  float wmin, float wmax,
  float lmin, float lmax,
  float omin, float omax
  )
{
  var prev = this.getGraphics().strokeWeight;
  var x = origin.x;
  var y = origin.y;
  for(int i = 0; i<count; i++)
  {
    var weight = (wmin+(wmax-wmin)*noise(i));
    strokeWeight(weight);

    var length = (lmin+(lmax-lmin)*noise(i));
    line(x,y,x,y+length);

    var offset = (omin+(omax-omin)*noise(i));
    x+=offset;
  }
  strokeWeight(prev);
}DrawAlignVNoiseWLO(new PVector(10,100),100,10,100,10,200,1,10);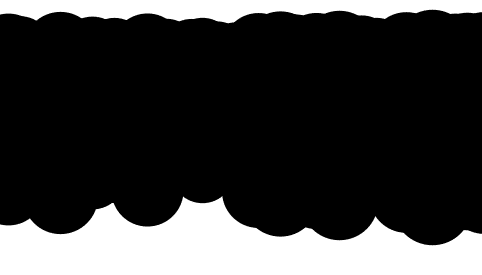
DrawAlignVNoiseWLO(new PVector(10,100),100,1,10,10,200,1,10);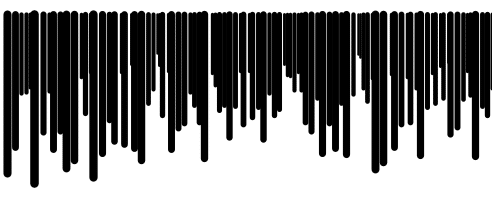
関数を用いる
横線を横に並べる
strokeWeightはeaseInSine関数に従う。
void DrawAlignHWf(PVector origin, float unit_line_length, int line_count, float wmax, EaseFunc func)
{
  var prev = this.getGraphics().strokeWeight;
  var x = origin.x;
  var y = origin.y;

  float resolution = (float)1/(float)line_count;

  for(int i = 0; i<line_count; i++)
  {
    var weight = wmax*func.exe(resolution*i);
    strokeWeight(weight);
    line(x,y,x+unit_line_length,y);
    x+=unit_line_length;
  }
  strokeWeight(prev);
}
static float easeInSine(float x){return 1 - cos((x * PI) / 2);}DrawAlignHWf(new PVector(10,250),2,200,200,((x)->easeInSine(x)));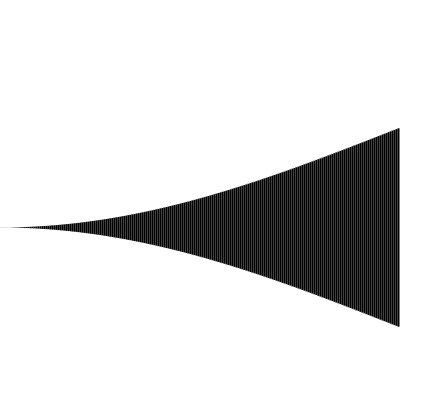
縦線を横に並べる
strokeWeightはノイズ
offsetはeaseInSine関数に従う。
void DrawAlignVWfr(
  PVector origin, float region_w, int count, float v_length, EaseFunc func, float wmin, float wmax)
{
  var prev = this.getGraphics().strokeWeight;
  float resolution = (float)1/(float)count;
  var x = origin.x;
  var y = origin.y;
  for(int i = 0; i<count; i++)
  {
    var weight = (wmin+(wmax-wmin)*noise(i));
    strokeWeight(weight);

    var offset = region_w*func.exe(resolution*i);
    line(x+offset,y,x+offset,y+v_length);
  }
  strokeWeight(prev);
}
static float easeInSine(float x){return 1 - cos((x * PI) / 2);}strokeCap(SQUARE);
DrawAlignVWfr(new PVector(10,100),400,50,100,((x)->easeInSine(x)),1,10);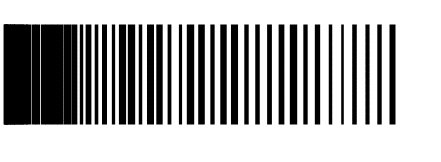
座標の保存、パラメータの保存
反復配置型を突き詰めていくと、最終的に座標値を計算して
List<PVector>として座標値を保存しておけば、あとはループして描画すれば良いという話になります。
ところが反復配置を前提としてList<PVector>で座標を保存していると、今度は一番最初の例にあるような、座標間を繋ぐようなグリッドを描画するのが意外にめんどくさいことがわかります。
矩形のグリッドの、格子の交点位置を計算してList<PVector>として保存してみます。反復配置を前提としたインデックス処理にご注意ください。それ以外はなんてこたない処理です。
static List<PVector> MakeAbsGrid(
  PVector abs_origin,
  int row_count, int col_count,
  float cell_w, float cell_h)
{
  List<PVector> ret = new ArrayList<PVector>();
  for(int i = 0; i<row_count; i++)
  {
    for(int j = 0; j<col_count; j++)
    {
      float x = abs_origin.x+(cell_w*j);
      float y = abs_origin.y+(cell_h*i);
      var v = new PVector(x,y);
      ret.add(v);
    }
  }
  return ret;
}
ここから、List<PVector>をループ処理だけして、グリッドを描画することを考えます。
すると横線はそれなりに引けても、縦線はいかんともしがたい。あるいは逆に縦線はいけるが、横線はなんともみたいな状態になります。
これはグリッド構造が2次元なのに対して、リスト構造が1次元だからです。行(あるいは列)の折り返しに必要な情報が消えたからです。グリッド交点座標を計算する時にはあった情報が、Listに保存することで消えたからです。解決策はいくつかあります。
その1:二重配列PVector[][]で保存する。あるいはList<List<PVector>>。
グリッド構造は結局、多重な配列構造でしかないため、それをそのままのデータ構造として保存します。つまりグリッド交点座標を求めるときに用いた情報を、暗黙の内に二重配列構造にも保存します。問題があるとすれば、多重な配列構造は存在そのものがめんどくさいということです。
その2:グリッドの行、列。全体のwidth,height。あるいはセルのwidth,heightなんかをどっかに保存しておく。
つまりグリッド交点座標を求める時に用いた情報を捨てずに、グリッド描画時にも使用します。
これの問題は、パラメータがあっちゃこっちゃにあると管理がめんどくさいということです。
その3:ループ毎に座標値を確認し、折り返しを判定する。
保存されたグリッド交点座標から強引に折り返したか否かを判定します。例えばxが減ったら折り返した、yが増えたら折り返した等と判定できます。めんどくさいです。
その4:パラメータによるグリッド構造の再生。
列情報からグリッド構造を再生します。つまり最小限の情報だけをとっときます。以下の例に見るように大変にめんどうですが、応用が効きそうなのがわかります。
というのも、ここでやっているのは配列と二重配列の変換だからです。
中身にたまたまグリッドの交点座標なるものを格納しているため、グリッドの交点座標を計算した時と同じパラメータを用いないと表示がずれてしまいます。
Listに格納している情報が文字や画像、幾何に必要なパラメータであるのなら、任意の個数で折り返して並べるというような操作ができます。
//wrap_index:折り返しindex
void DrawRectGrid(List<PVector> grid, int wrap_index)
{
  int grid_row_count = grid.size()/wrap_index;
  for(int i = 0; i<grid.size(); i++)
  {
    //Listのindexに折り返しを適用する
    int x=i%wrap_index;
    int y=i/wrap_index;
    var v = grid.get(i);

    //右にまだ頂点があるなら
    if(x<wrap_index-1)
    {
      var rv = grid.get(i+1);
      line(v.x,v.y,rv.x,rv.y);
    }
    //下にまだ頂点があるなら
    if(y<grid_row_count -1)
    {
      var dv = grid.get(i+wrap_index);
      line(v.x,v.y,dv.x,dv.y);
    }
  }
}
配列の変換に着目した応用例
void DrawAlignRect(List<PVector> grid, int wrap_index, float cell_x, float cell_y)
{
  int grid_row_count = grid.size()/wrap_index;
  for(int i = 0; i<grid.size(); i++)
  {
    //Listのindexに折り返しを適用する
    int x=i%wrap_index;
    int y=i/wrap_index;
    var v = grid.get(i);

    rect(cell_x*x,cell_y*y,v.x,v.y);
  }
}
適当なパラメータ
List<PVector> MakeRandomSeedVec(int n, float min, float max)
{
  List<PVector> ret = new ArrayList<PVector>();
  for(int i = 0; i<n; i++)
  {
    randomSeed(i);
    ret.add(new PVector(random(min,max),random(min,max)));
  }
  return ret;
}
使い方:50行で折り返しているがそうしないこともできる。
  int cell_x = 10;
  int cell_y = 10;
  var v = MakeRandomSeedVec(1000,0,cell_x);
  DrawAlignRect(v,50,cell_x,cell_y);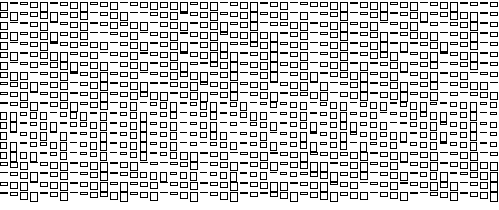
極座標の場合
以下の例では中心点を重複生成しています。
//原点(中心点)を列分作る(重複頂点をth_count個作成する)
static List<PVector> MakePolarGrid(
  PVector abs_origin,
  int r_count, int th_count,
  float radius)
{
  List<PVector> ret = new ArrayList<PVector>();

  float unit_radian = 2*PI/th_count;

  for(int i = 0; i<r_count; i++)
  {
    for(int j = 0; j<th_count; j++)
    {
      float x = abs_origin.x+(radius*i*sin(unit_radian*j));
      float y = abs_origin.y+(radius*i*cos(unit_radian*j));
      var v = new PVector(x,y);
      ret.add(v);
    }
  }
  return ret;
}
void DrawPolarGrid(List<PVector> grid, int wrap_index)
{
  int grid_h_count = grid.size()/wrap_index;

  for(int i = 0; i<grid.size(); i++)
  {
    //Listのindexに折り返しを適用する
    int x=i%wrap_index;
    int y=i/wrap_index;

    var v = grid.get(i);

    //円周上
    if(x<wrap_index-1)
    {
      var rv = grid.get(i+1);
      line(v.x,v.y,rv.x,rv.y);
    }
    //最後閉じる
    else
    {
      var rv = grid.get(i-wrap_index+1);
      line(v.x,v.y,rv.x,rv.y);
    }

    //中心へ
    if(y<grid_h_count-1)
    {
      var dv = grid.get(i+wrap_index);
      line(v.x,v.y,dv.x,dv.y);
    }
  }
}この記事が気に入ったらサポートをしてみませんか?