
Data Log Analysis and Management with Kibana's Drilldown

Japanese version is here.
Burmese version is here.
Hello! I am Thandar Khine Aye from Airitech, Inc. located in Tokyo, Japan.
Currently, I am working in Big Data/AI Utilization Group #1 of Airitech which utilizes Elasticsearch and Kibana to manage (a robot's/our robot's/robotic?) movement logs and analyzes such data with Robot Process Automation (RPA) technology.
Target Audience:
● those who want to improve analysis and data resolution skills
● those who want to be able to more effectively analyze and use data for troubleshooting
● those who want to dig deep into data logs and trace workflows
In this article, I would like to introduce Kibana's Drilldown function, which can be used to realize all of the skills above.
What is Kibana's Drilldown?
Drilldown makes it easier to create workflows for analyzing data and troubleshooting by providing more detailed information about their dashboards.
Drilldowns can be created in the Visualize panel of Kibana. Each panel can contain multiple Drilldowns.
Types of Drilldown
Kibana's Visualize supports two types of Drilldown.
In these two types, Dashboard Drilldown is supported in Kibana 7.8 and URL Drilldown is supported in Kibana 7.10.
Drilldown types can be implemented differ depending on the type of Visualize.
1. Dashboard Drilldown
- Connecting from one dashboard to another
- Supporting start From Kibana 7.8
- Valid with Basic License (cannot used with OSS version)
2. URL Drilldown
- Connecting from the dashboard to an internal or external URL
- Supporting start From Kibana 7.10 (beta)
- Valid with Gold License (cannot used with OSS version and Basic License)
We can define Drilldown actions for many types of visualizations, such as bar charts and pie charts.
Please note that some types of visualization cannot be used.
Reference: https://www.elastic.co/guide/en/kibana/current/drilldowns.html
How to use Dashboard Drilldown
Among the two types of Drilldown, this article mainly focus on Dashboard Drilldown.
Use Drilldown function on the data which you want to further analyze from your dashboard and open results with a new dashboard.
Time ranges, Filters, and other parameters data can be inherited, so it may be analyzed in much the same context.
Moreover, It also helps to analyze your data from a new perspective.
Let's create a dashboard which can show us a concrete example of Drilldown.
1. Create Dashboard
This time, we will add a Drilldown action to the pie chart of dashboard that visualizes the RPA execution statuses.
This chart shows the ratio of the creation time by RPA (work done by the robot which converted to the time when a person works) for each type of processing.
Next, when clicking inside the chart we can transition to another dashboard where we can further visualize the details of the process.
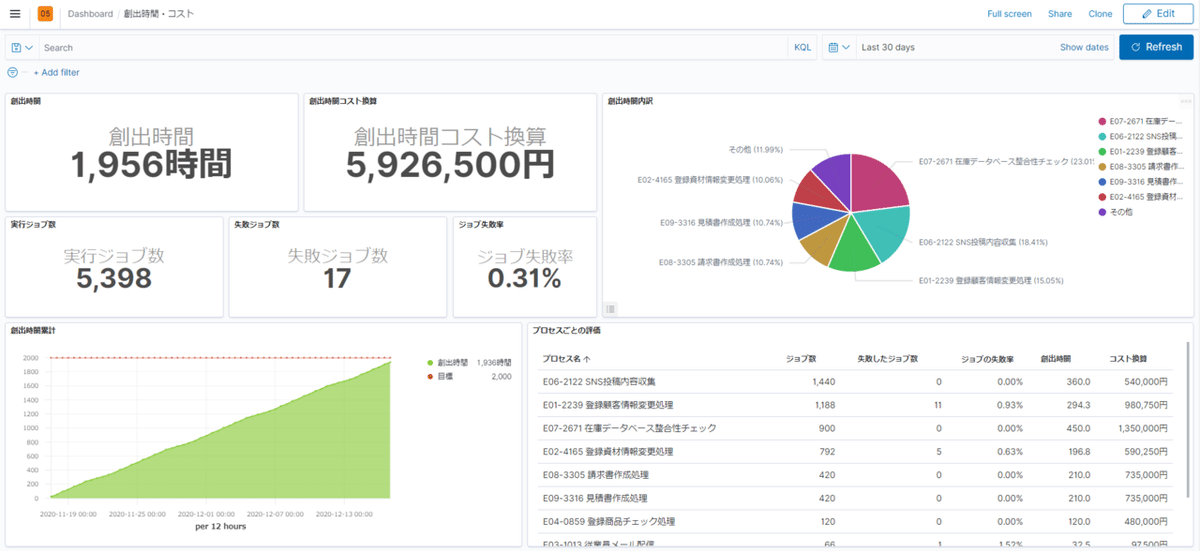
Figure 1: Kibana Dashboard
- Press the "Edit" button in dashboard to change to Edit mode.
- Select "Create drilldown" from the Visualize Setting icon of the pie chart.
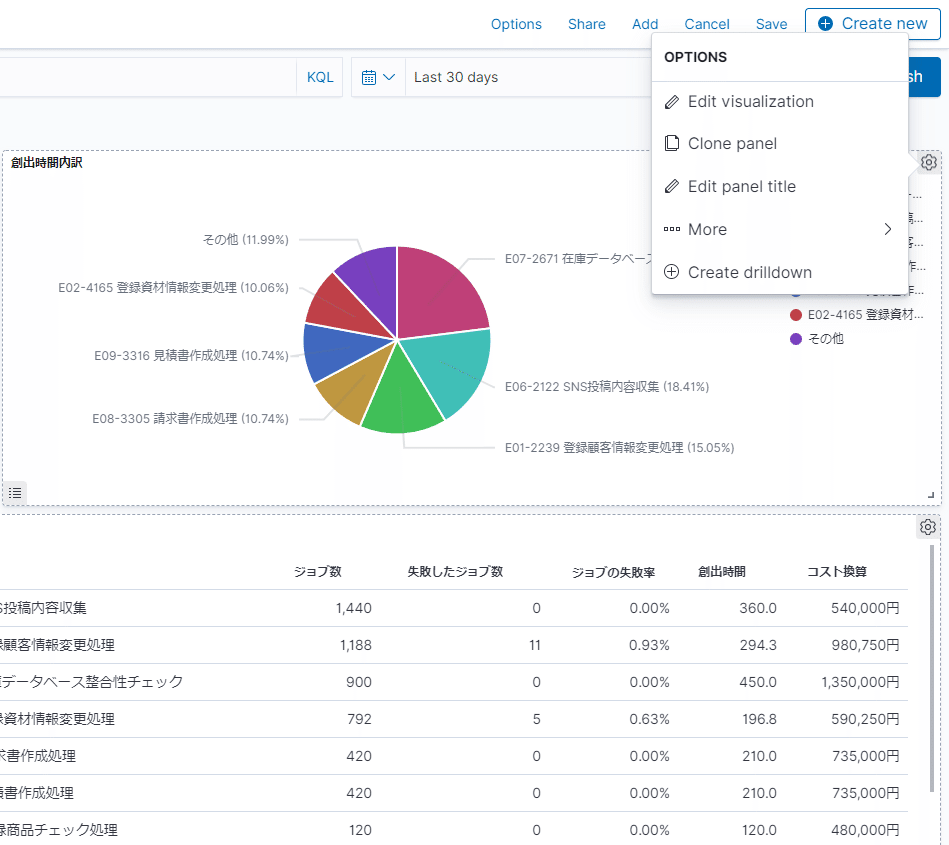
Figure 2: [Create drilldown] menu
- Set the Drilldown name.
It is a Drilldown to dashboard that displays the details of the process.
The name will be "Details of the execution status of the process".
(処理の実行状況の詳細 = Details of processing execution status)

Figure 3: Drilldown name setting and action selection
- Select "Go to Dashboard", two selection items will be displayed as shown below. Check both of them this time.

Figure 4: Dashboard Drilldown settings
- Next, select another dashboard from "Choose destination dashboard" to display the result of Drilldown.
Select the dashboard from multiple dashboards which you already created, for which you want to display the results.
Press the "Create drilldown" button.

Figure 5: Select the dashboard for which want to display the results

Figure 6: To create a Drilldown, press the "Create drilldown" button
- When you have finished creating the Drilldown, click the "Save" link to save the dashboard. You have now created a dashboard Drilldown.
2. Using Dashboard Drilldown
Let's continue for using Drilldown, after saving the dashboard.
Click on a part of the pie chart to see the menu choices as shown in the image below.
From that menu, select the Drilldown which you created.
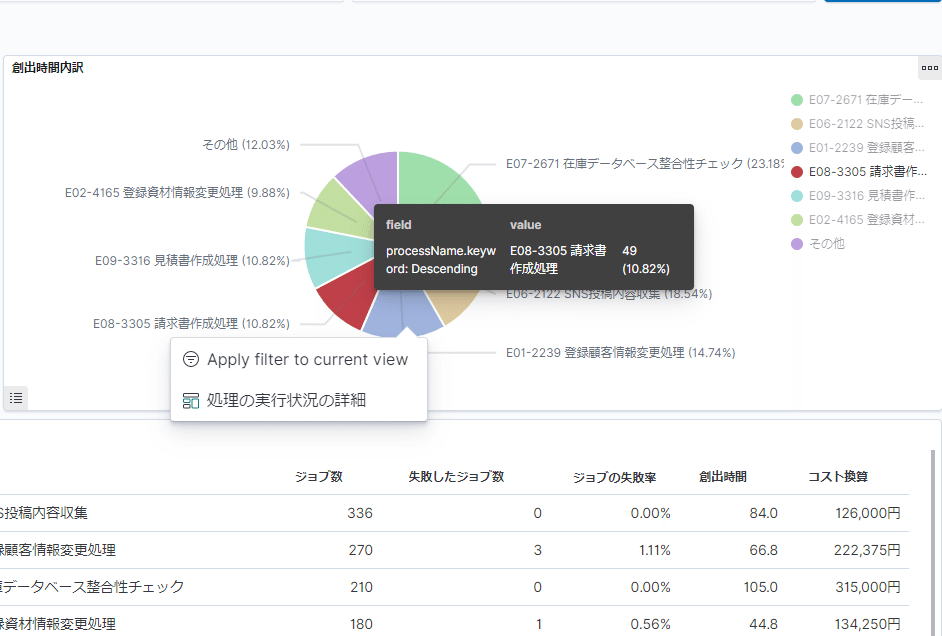
Figure 7: Select the created Drilldown
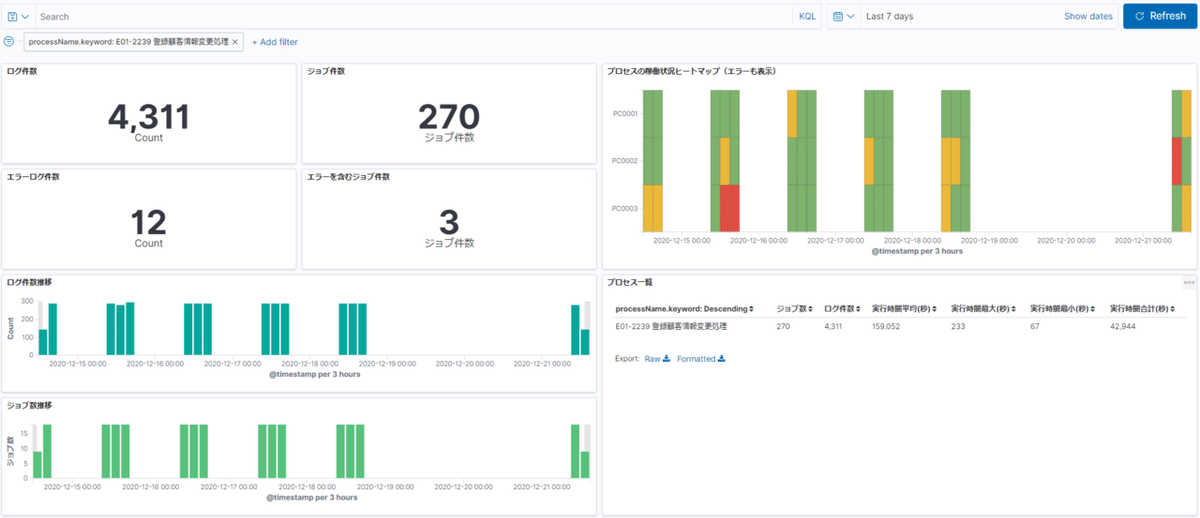
Figure 8: Display result after using the Drilldown function
3. Edit Drilldown
- Press the "Edit" button from dashboard to change to Edit mode.
- Select "Manage drilldowns" from the Setting icon of Visualize that set Drilldown earlier.

Figure 9: "Manage drilldowns" menu
- We can edit, add, and delete Drilldown.

Figure 10: Drilldown Edit, Add and Delete
Summary
By following this article and working with the new Kibana Drillsdown function, we have hopefully allowed you to improve your efficiency of data utilization by showing how to check the data logs in details from the dashboard. Please refer to it whenever you create a dashboard.
Airitech also provided various services from troubleshooting and system performance services to introducing and supporting big data analysis tools.
We offer online training for Elasticsearch and Kibana for UiPath users.
If you are interested in Elasticsearch/Kibana, please join us.
Elasticsearch / Kibana training (Online Seminar)
https://www.airitech.co.jp/service/bigdata/uipath_elasticsearch_training/
We are also looking for Elasticsearch engineers, so if you are interested, please apply. Click here for Airitech's recruitment information
https://www.airitech.co.jp/recruit/
Our Home Page
https://www.airitech.co.jp/
この記事が気に入ったらサポートをしてみませんか?