
QB 国試の学内順位を表示したい!

はじめに
Question Bankの国試問題を解いていると、問題数の進捗具合を示すグラフがありますが、その図には学内順位が載っていないと思います。今回はグラフのプロットを、Chromeの拡張機能を使って読みとり、自分の順位を把握できるツールを作ったのでメモしておきます。
昨日との演習数の増減もできるので、勉強のモチベが維持できると思います。
また本記事のさいごに、一般公開した拡張機能を載せましたので、ぜひ使っていただけるとありがたいです!
現在の環境
Windows11 (Mac book pro M1でも動作確認済み)
Google Chrome バージョン: 126.0.6478.182
ステップ1: ファイルの作成
以下のファイルを1つのフォルダにまとめます:
manifest.json
popup.html
popup.js
imagesフォルダ内の画像ファイル:
icon16.png
icon48.png
icon128.png
background.png
ステップ2: jsonファイルを作成する
’manifest.json’という名前のファイルを作成し、以下の内容を記述します:
{
  "manifest_version": 3,
  "name": "Graph Data Ranker",
  "version": "1.0.0",
  "description": "Question Bankの国試の学内ランキングを表示させるツールです。成績のグラフが表示されているときにボタンを押すと、成績推移等が表示されるようになっています。",
  "permissions": ["activeTab", "scripting"],
  "action": {
    "default_popup": "popup.html",
    "default_icon": {
      "16": "images/icon16.png",
      "48": "images/icon48.png",
      "128": "images/icon128.png"
    }
  }
}
ステップ3: HTML ファイルの作成
次に、`popup.html`という名前のファイルを作成し、以下の内容を記述します:
<!DOCTYPE html>
<html>
<head>
    <meta charset="UTF-8">
    <title>Graph Data Ranker</title>
    <style>
        body {
            font-family: Arial, sans-serif;
            display: flex;
            flex-direction: column;
            align-items: center;
            background-color: #f4f4f9;
            margin: 0;
            padding: 20px;
            width: 300px;
            height: 450px;
            box-sizing: border-box;
            border-radius: 10px;
            box-shadow: 0 0 10px rgba(0, 0, 0, 0.1);
            position: relative;
            overflow: hidden;
        }
        body::before {
            content: '';
            position: absolute;
            top: 0;
            left: 0;
            width: 100%;
            height: 100%;
            background-image: url('images/background.png');
            background-repeat: no-repeat;
            background-position: center;
            background-size: cover;
            opacity: 0.35;
            z-index: 0;
        }
        h1, p, button, #output {
            position: relative;
            z-index: 1;
        }
        h1 {
            color: #333;
            font-size: 2.0em;
            margin-bottom: 10px;
        }
        p {
            color: #333;
            text-align: center;
            font-size: 1.3em;
            margin-bottom: 20px;
            text-shadow: 1px 1px 0 #fff, -1px -1px 0 #fff, 1px -1px 0 #fff, -1px 1px 0 #fff;
            font-weight: bold;
        }
        button {
            margin: 10px 0;
            padding: 15px 30px;
            font-size: 1.6em;
            background-color: #007BFF;
            color: white;
            border: none;
            border-radius: 5px;
            cursor: pointer;
            transition: background-color 0.3s ease, transform 0.3s ease;
            outline: none;
        }
        button:hover {
            background-color: #0056b3;
            transform: scale(1.05);
        }
        #output {
            margin-top: 20px;
            padding: 10px;
            border: 1px solid #ddd;
            border-radius: 5px;
            background-color: white;
            opacity: 0.85;
            width: 100%;
            text-align: left;
            font-size: 1.2em;
            box-shadow: 0 0 5px rgba(0, 0, 0, 0.1);
        }
    </style>
</head>
<body>
    <h1>Graph Data Ranker</h1>
    <p>順位が表示されるところで下のボタンを押してください</p>
    <button id="calculate-rank">Rank</button>
    <div id="output"></div>
    <script src="popup.js"></script>
</body>
</html>
ステップ4: JavaScript ファイルの作成
次に、’popup.js’という名前のファイルを作成し、以下の内容を記述します:
// 'calculate-rank'というIDを持つ要素にクリックイベントリスナーを追加
document.getElementById('calculate-rank').addEventListener('click', () => {
// 現在のウィンドウでアクティブなタブをクエリ
chrome.tabs.query({ active: true, currentWindow: true }, (tabs) => {
// アクティブなタブのコンテキストでcalculateRank関数を実行
chrome.scripting.executeScript({
target: { tabId: tabs[0].id },
function: calculateRank
}, (results) => {
// 結果が利用可能で、期待されるデータが含まれているか確認
if (results && results[0] && results[0].result) {
// 'output'というIDを持つ要素を取得
const output = document.getElementById('output');
// 結果からデータを抽出
const { rankY, rankX, scoreX, total, yesterdayRank, yesterdayCount, dayBeforeYesterdayCount } = results[0].result;
// 演習数の増減を計算
let countChange = 'N/A';
let countChangeStyle = '';
if (yesterdayCount !== 'N/A' && dayBeforeYesterdayCount !== 'N/A') {
const difference = yesterdayCount - dayBeforeYesterdayCount;
if (difference > 0) {
countChange = `(+${difference}問)`;
countChangeStyle = 'color: red;';
} else if (difference < 0) {
countChange = `(−${Math.abs(difference)}問)`;
countChangeStyle = 'color: blue;';
} else {
countChange = '(±0問)';
countChangeStyle = 'color: black;';
}
}
// 結果をHTMLとして出力エリアに挿入
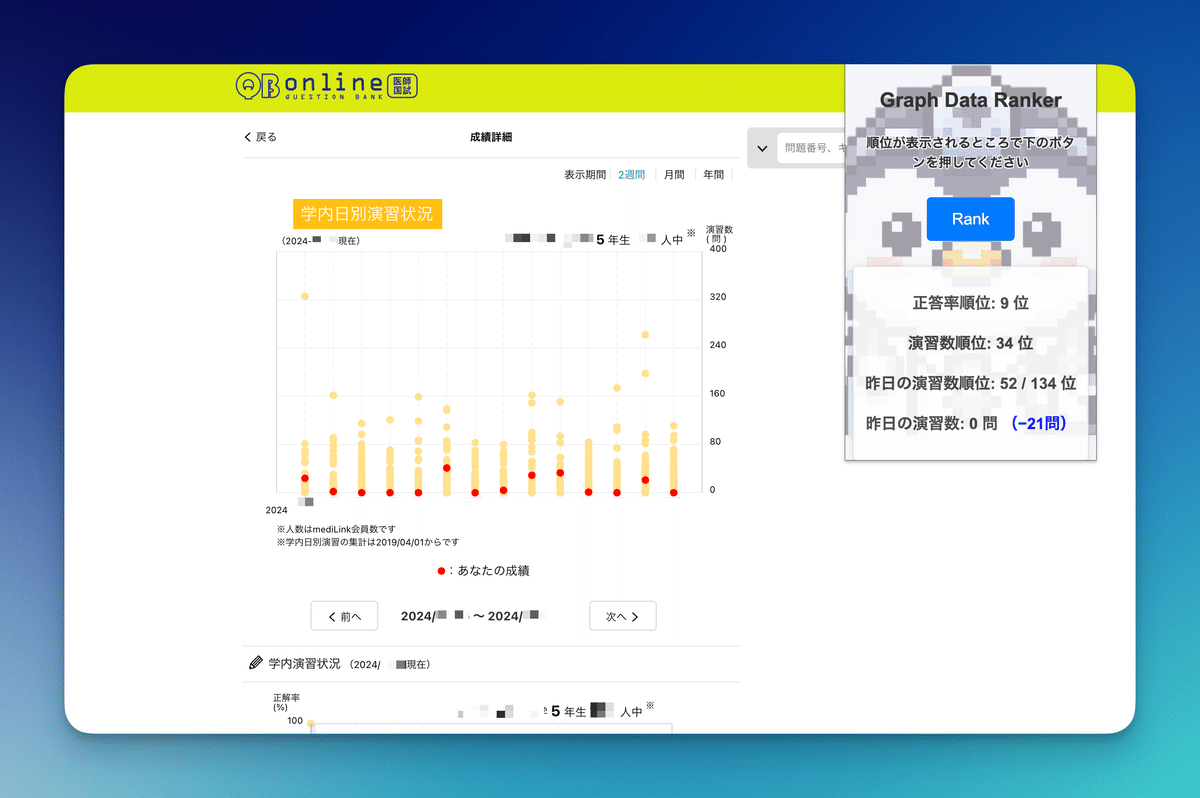
output.innerHTML = `
<p>正答率順位: ${rankY} 位</p>
<p>演習数順位: ${total - rankX} 位</p>
<p>昨日の演習数順位: ${yesterdayRank} / ${total} 位</p>
<p>昨日の演習数: ${yesterdayCount} 問 <span style="${countChangeStyle}">${countChange}</span></p>
`;
}
});
});
});
// calculateRank関数の定義
function calculateRank() {
// ハイライトされたデータポイントを取得
const myPoint = document.querySelector('.graph__my-data-circle--highlighted');
// データポイントが存在しない場合、N/Aを返す
if (!myPoint) {
return { rankY: 'N/A', rankX: 'N/A', scoreX: 'N/A', total: 'N/A', yesterdayRank: 'N/A', yesterdayCount: 'N/A', dayBeforeYesterdayCount: 'N/A' };
}
// データポイントの座標を取得
const myScoreY = parseFloat(myPoint.getAttribute('cy'));
const myScoreX = parseFloat(myPoint.getAttribute('cx'));
// 座標が数値でない場合、N/Aを返す
if (isNaN(myScoreY) || isNaN(myScoreX)) {
return { rankY: 'N/A', rankX: 'N/A', scoreX: 'N/A', total: 'N/A', yesterdayRank: 'N/A', yesterdayCount: 'N/A', dayBeforeYesterdayCount: 'N/A' };
}
// 他のデータポイントを取得
const otherPoints = document.querySelectorAll('.graph__data-circle--qb');
// 他のデータポイントの座標を取得し、配列に変換
let otherScores = Array.from(otherPoints).map(point => ({
x: parseFloat(point.getAttribute('cx')),
y: parseFloat(point.getAttribute('cy'))
}));
// 自分のスコアを配列に追加
otherScores.push({ x: myScoreX, y: myScoreY });
// データポイントの総数を取得
const total = otherScores.length;
// 正答率順位の計算
otherScores.sort((a, b) => a.y - b.y);
const myRankY = otherScores.findIndex(score => score.x === myScoreX && score.y === myScoreY) + 1;
// 演習数順位の計算
otherScores.sort((a, b) => a.x - b.x);
const myRankX = otherScores.findIndex(score => score.x === myScoreX && score.y === myScoreY) + 1;
// 昨日とおとといのデータポイントを取得
const myDataPoints = Array.from(document.querySelectorAll('.graph__circle--my-data')).sort((a, b) => parseFloat(b.getAttribute('cx')) - parseFloat(a.getAttribute('cx')));
const yesterdayPoint = myDataPoints[0];
const dayBeforeYesterdayPoint = myDataPoints[1];
const yesterdayCount = yesterdayPoint ? parseInt(yesterdayPoint.getAttribute('data-count')) : 'N/A';
const dayBeforeYesterdayCount = dayBeforeYesterdayPoint ? parseInt(dayBeforeYesterdayPoint.getAttribute('data-count')) : 'N/A';
// 昨日のデータポイントが存在しない場合、N/Aを返す
if (!yesterdayPoint) {
return { rankY: myRankY, rankX: myRankX, scoreX: myScoreX, total, yesterdayRank: 'N/A', yesterdayCount: 'N/A', dayBeforeYesterdayCount };
}
// 昨日の他のデータポイントをフィルタリング
const yesterdayPoints = Array.from(document.querySelectorAll('.graph__circle--qb')).filter(point => {
return parseFloat(point.getAttribute('cx')) === parseFloat(yesterdayPoint.getAttribute('cx'));
});
// 昨日の参加者の総数を取得
const totalYesterdayParticipants = yesterdayPoints.length;
// 昨日のデータポイントの座標とカウントを取得し、配列に変換
let yesterdayScores = yesterdayPoints.map(point => ({
x: parseFloat(point.getAttribute('cx')),
y: parseFloat(point.getAttribute('cy')),
count: parseInt(point.getAttribute('data-count'))
}));
// 昨日の正答率順位の計算
yesterdayScores.sort((a, b) => a.y - b.y);
const yesterdayRank = yesterdayScores.findIndex(score => score.y === parseFloat(yesterdayPoint.getAttribute('cy'))) + 1;
// 昨日の演習数が0の場合、最下位タイの人数を考慮
let yesterdayRankAdjusted = yesterdayRank;
if (yesterdayCount === 0) {
const countOfZeros = yesterdayScores.filter(score => score.count === 0).length;
yesterdayRankAdjusted = totalYesterdayParticipants - countOfZeros + 1;
}
// 計算結果を返す
return { rankY: myRankY, rankX: myRankX, scoreX: myScoreX, total, yesterdayRank: yesterdayRankAdjusted, yesterdayCount, dayBeforeYesterdayCount };
}
ステップ5 imagesフォルダの作成
imagesフォルダに、以下の写真のようなpng形式のファイルを作成します。
写真は自由ですが、ファイル名は
icon16.png
icon48.png
icon128.png
background.png
としてください。
参考
icon16.pngは [16×16 pixel] の意味です。
ステップ6 Chromeの拡張機能の実装
下ごしらえはいったん終わりで、次はChromeに拡張機能として加えていきます。
Chromeを開き、chrome://extensions/を開きます
右上の「デベロッパーモード」をオンにします
「パッケージ化されていない拡張機能を読み込む」をクリックし、作成したフォルダを選択します
これで拡張機能がChromeにインストールされ、有効化されます。
後は、いつも使っている拡張機能と同じです。
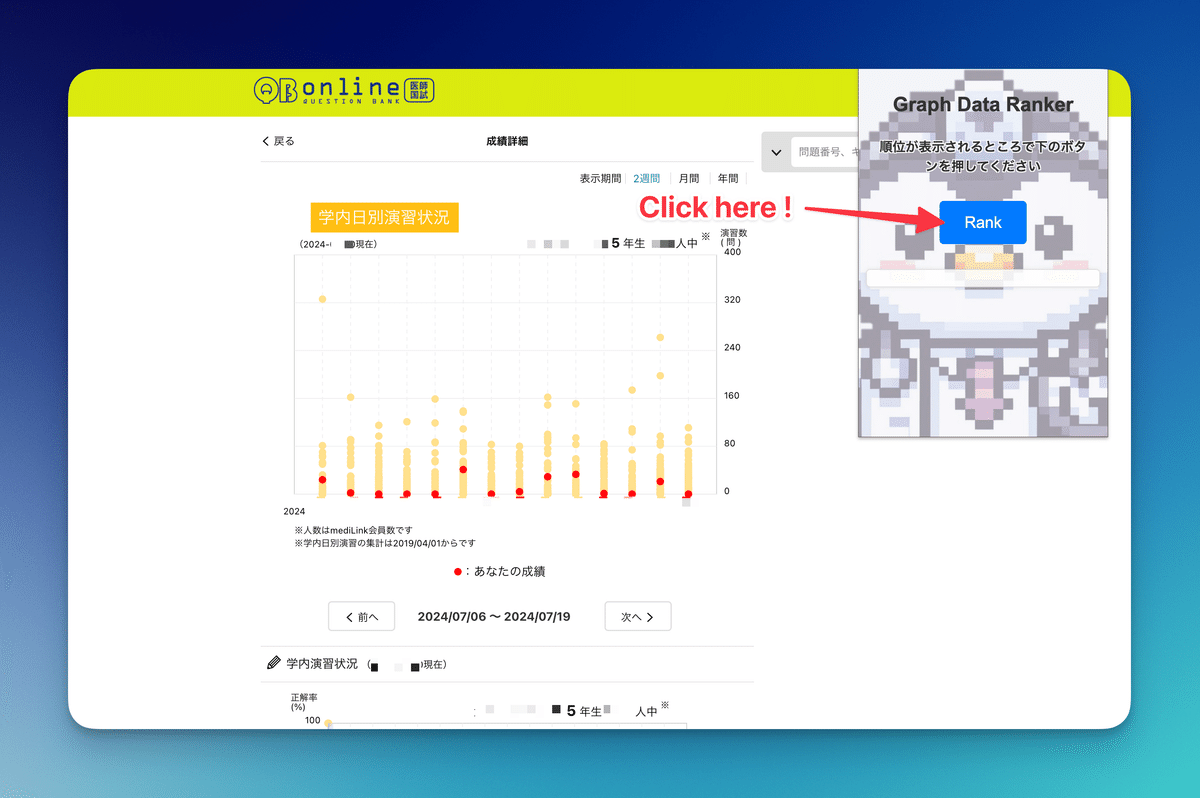
やり方
・QBの成績が表示されている画面で、拡張機能のボタンを押してください。

まとめ
このChrome拡張機能を使うことで、QBの国試問題の進捗具合を示すグラフから自分の学内順位を簡単に見れるようになります。
これでみなさんのモチベが上がればと思います。
これが拡張機能です!ぜひ使ってみて下さい!
(QB CBT版にはまだ対応していません。CBT版も要望があれば載せたいと思います。)
この記事が気に入ったらサポートをしてみませんか?