Pythonで箱ひげ図
(1)はじめに
Pythonで箱ひげ図を描きます。最終的には、前回の多重比較検定の結果と併せて、箱ひげ図に有意差検定の結果を描画できるようにします。
(2)全体コード
import pandas as pd
import matplotlib.pyplot as plt

df = pd.read_csv("iris.csv")

#箱ひげ図を描画するために、データを加工。
#dfのvariety列から'Setosa','Versicolor','Virginica'のsepal.lengthのみを抽出
data = [
    df[df['variety'] == 'Setosa']['sepal.length'],
    df[df['variety'] == 'Versicolor']['sepal.length'],
    df[df['variety'] == 'Virginica']['sepal.length']
    ]

#箱ひげ図は以下の1行のみ。
#labelsはラベル。
plt.boxplot(data, labels=['Setosa','Versicolor','Virginica'])
plt.show()
(3)解説
以下の部分は、matplotlib.pyplotで箱ひげ図を描画するためのデータの加工です。df[df['variety'] == 'Setosa']['sepal.length']は、「dfのvariety列から'Setosa'と一致する行のみを取り出し、その後sepal.lengthの列のみを抽出する」という処理です。
#箱ひげ図を描画するために、データを加工。
#dfのvariety列から'Setosa'と一致する行のみを取り出し、その後sepal.lengthの列のみを抽出する
data = [
    df[df['variety'] == 'Setosa']['sepal.length'],
    df[df['variety'] == 'Versicolor']['sepal.length'],
    df[df['variety'] == 'Virginica']['sepal.length']
    ]
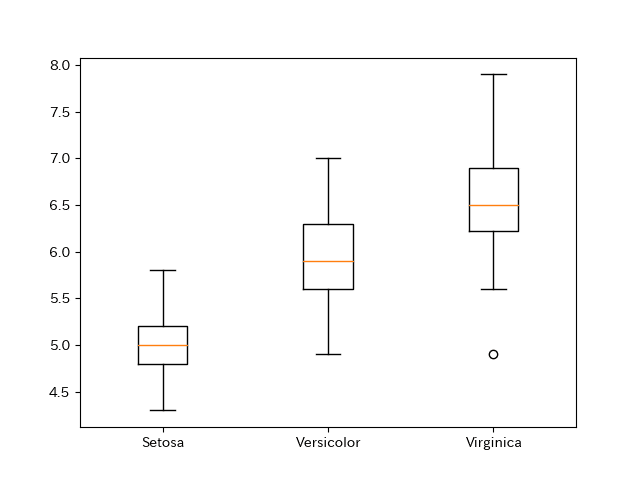
実際の箱ひげ図の描画は以下です。
#箱ひげ図は以下の1行のみ。
#labelsはラベル。
plt.boxplot(data, labels=['Setosa','Versicolor','Virginica'])
こんな図になります。

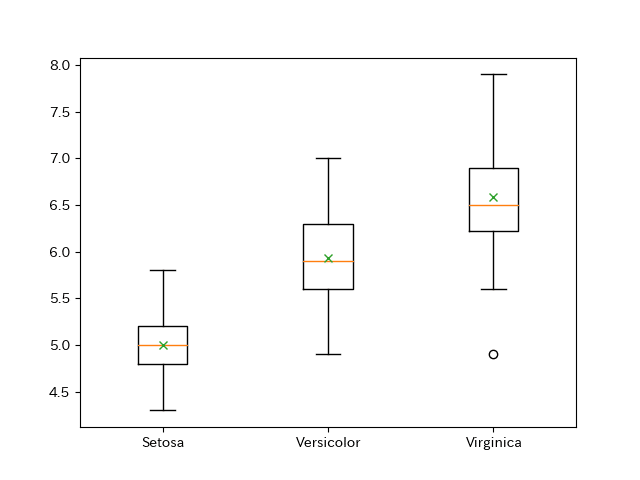
(3-1)平均値を示したいとき
平均値を示したいときは以下のコードです。×でなくて、▲とかもできます。中央値と同じくラインにもできます。
plt.boxplot(data, labels=['Setosa','Versicolor','Virginica'],
            showmeans=True, meanprops={"marker":"x"})
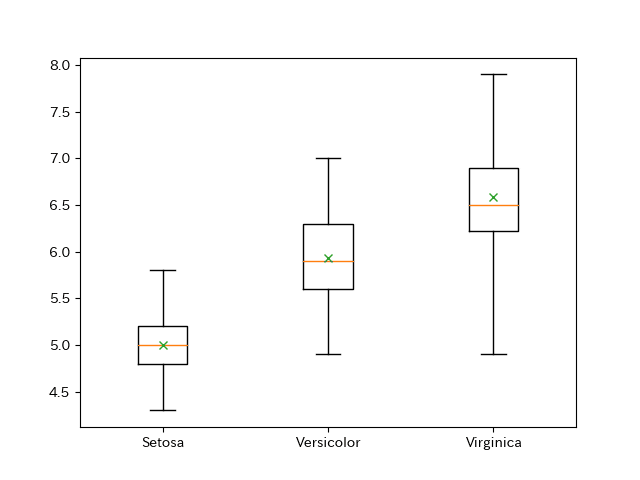
(3-2)外れ値を含めて描画したいとき
外れ値を含めて描画したいときは以下のコードです。個人的にはこちらを使います。
plt.boxplot(data, labels=['Setosa','Versicolor','Virginica'], whis=[0, 100],
            showmeans=True, meanprops={"marker":"x"})
コードの中にあるmeanpropsは、サイズや色等も指定できます。詳しくは参考のホームページをご確認ください。
(4)参考
https://matplotlib.org/stable/gallery/statistics/boxplot.html
