【Matplotlib】棒グラフいろいろ

matplotlibで棒グラフを書く方法はいくつかあるので、まとめてみました。
①matplotlib.pyplot.bar
matplotlib.pyplotはpltにするので、いわゆるplt.bar()。
matplotlib.pyplot.bar(x, height, width=0.8, bottom=None, *, align='center', data=None, **kwargs)
Parameters:
x : float or array-like
The x coordinates of the bars. See also align for the alignment of the bars to the coordinates.
height : float or array-like
The height(s) of the bars.
x, yというより、xとその高さ。y=df["height"]とするとエラーになります。

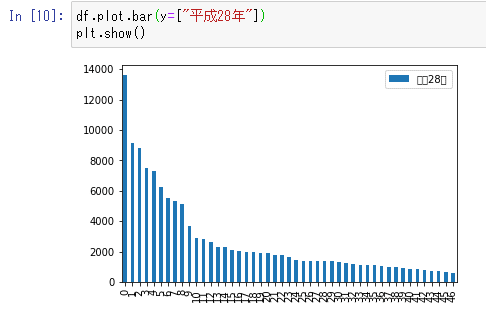
②DataFrame.plot.bar()
y軸しか指定しない場合。plt.bar()はx軸指定しないとエラー。
DataFrame.plot.bar(x=None, y=None, **kwargs)
Parameters
x : label or position, optional
Allows plotting of one column versus another. If not specified, the index of the DataFrame is used.
y : label or position, optional
Allows plotting of one column versus another. If not specified, all numerical columns are used.
xもyもoptionalなんですね。xが指定されなければ、DataFrameのインデックスが使用される。
2列を棒グラフにする


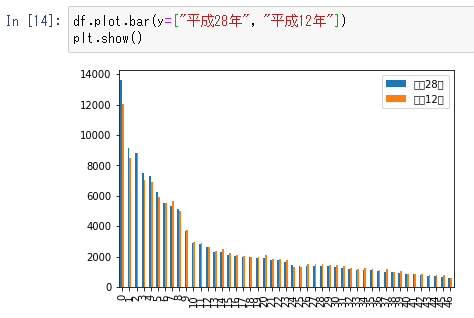
DataFrameで2列を指定する時は、[["平成28年", "平成12年"]]のように、[]を二重にすることが多いけれど、ここではエラーになる。
この記事が気に入ったらサポートをしてみませんか?