Making of Constellation Viz Part 1 : Drawing constellations

Thank you for visiting my blog.
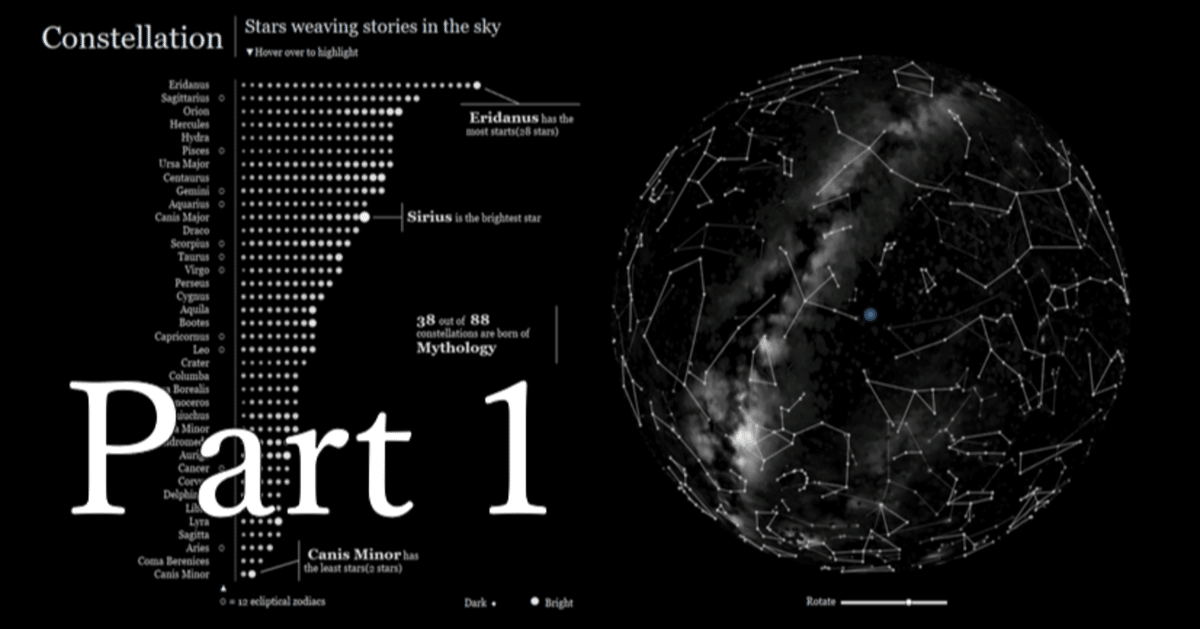
This blog is the first one of series blogs to talk about my tableau viz "Constellation : Stars weaving stories in the sky".
The viz is on tableau public.
Also, tableau packaged workbook is downloadable form following link.
(I updated the workbook on September 2nd 2020. If you have downloaded from tableau public before, please download again from following link.)

Part 1 : Drawing constellations
For the 1st step, we will draw constellation with tableau.
About data tables
We use 3 data tables as following.
Originally these data tables came from former Zen Master Yoshihito Kimura's blog.
https://tableauzm.blogspot.com/2018/02/star-map-project-english.html
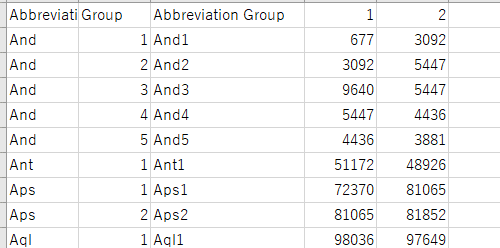
The first data table "constellation_line_hip" includes
- Abbreviation ( abbreviation of constellation )
- Group ( Index no. of lines in each constellation )
- Abbreviation Group ( Abbreviation + Group )
-1 ( HIP number of a star which is staring point of each line )
-2 ( HIP number of a star which is ending point of each line )
*HIP numbers are unique numbers for each star in the sky.
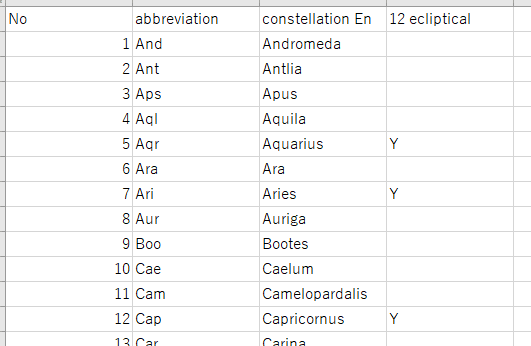
The second data table "constellation_name" includes
- No (index number of constellation )
- abbreviation ( abbreviation of constellation ) = This will be key field to join.
- constellation En ( Name of constellation in English )
- 12 ecliptical ( the flag if each constellation is one of 12 ecliptical zodiacs )
The third data table "star_name_position_hip" includes
- HIP ( HIP number of each star )
*HIP numbers. are unique numbers for each star in the sky.
- right ascension_lon
Refer https://en.wikipedia.org/wiki/Right_ascension and a figure below.
- declination_lat
Refer https://en.wikipedia.org/wiki/Declination and a figure below.
- apparent magnitude
Refer https://en.wikipedia.org/wiki/Apparent_magnitude
( Lower number means brighter. )
- Star Name ( Names of common star )


From Wikipedia : https://en.wikipedia.org/wiki/Right_ascension
Join data tables with tableau
Connect to the data table "constellation_line_hip"
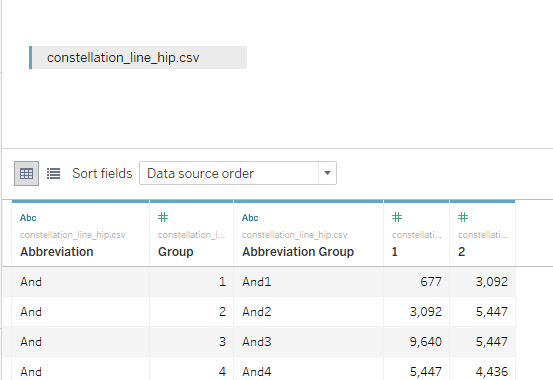
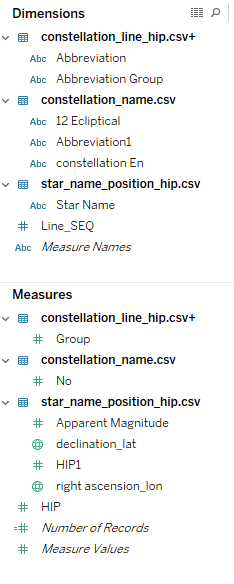
Pivot fileds 1 & 2

Rename field "Pivot Field Names" to "Line_SEQ",
Rename field "Pivot Field Values" to "HIP"
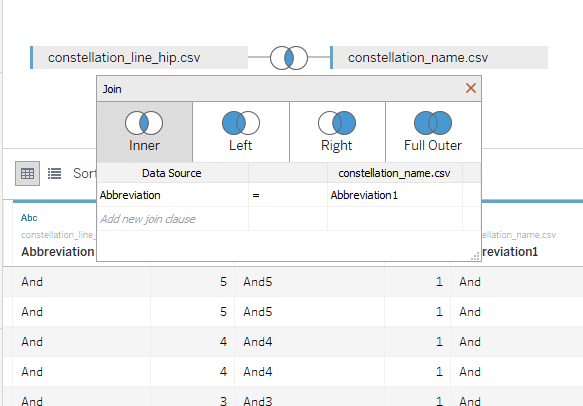
Join the data table "constellation_name" with the key field "abbreviation".
Join the data table "star_name_position_hip" with the key field "HIP".
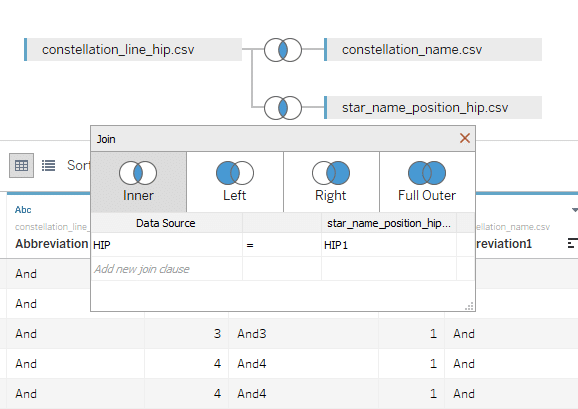
The result of join is as follows ( Side bar of Tableau 2020.1 or before )
[declination_lat] will be recognized as latitude.
and [right ascension_lon] will be recognized as longitude.
If not, set geographic role of them as latitude and longitude.
Plot constellations' lines
Put [declination_lat] on rows shelf
Put [right ascension_lon] on columns shelf
Change aggregation calculation to MIN ( to improve performance )

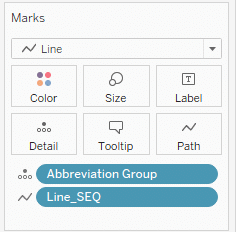
Change mark type to "Line"
Set detail as [Abbreviation Group]
Set path as [Line_SEQ]
The workbook will become as following.

Constellations are drawn on the map almost like shapes on the earth surface.
*Right and left are reversed against to the actual starry sky we see form the earth.
If you want to draw as the starry sky we see from northern sphere,
make a calculation filed -MIN([right ascension_lon]), and use it as longitude.

Also, If you want to draw as the starry sky we see from southern sphere,
make a calculation filed -MIN([declination_lat]), and use it as latitude.

We can change colors, colors-effect-markers and size of lines as we like.
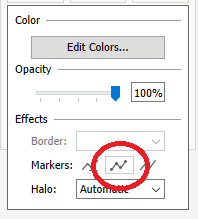
For example, I set color as white with 12 ecliptical zodiacs as purple.

These are explanation about Part 1.
Continued to next part.
https://note.com/ritz_tableau/n/nc83843ad8bd6
Thanks for reading.
By ritz_Tableau
Tableau Zen Master | Tableau Public Ambassador |
Tableau Certified Professional | Data Saber
Twitter : @ritz_Tableau
Tableau Public : https://public.tableau.com/profile/satoshi.ganeko#!/
この記事が気に入ったらサポートをしてみませんか?