Let's Talk About the New Image of the Tableau Creator

Introduction
San Diego, with its bright sunshine and vast ocean, feels surprisingly familiar despite it being my first visit. In May 2024, I attended the Tableau Conference for the second time. As a second-year Ambassador, I felt a sense of responsibility as a leader guiding my peers. The amazement and pride of seeing myself on the walls of the venue and the cover of the CEO section of the keynote were indescribable. I was having a fulfilling time. Or so I thought.
After listening to the two-hour keynote, I staggered out of the venue and found myself staring at the sea and the blue sky from the terrace, feeling half dazed. I sensed a change in the air. It was immediately apparent that not everyone in the DataFam shared the same excitement. The feeling had been there, at least since last year's Tableau Conference. Perhaps even before that. For the past year, I had been struggling. I knew it was becoming increasingly difficult to lead the Fam in the same way as before, but I didn't know what to do. Amid the excitement of the Tableau Conference, the year's worth of anxieties that I had pushed to the back of my mind came rushing in. What should I do from now on? The only thing I was certain of was that both I and the Fam needed a change—a change that is incredibly cool and true to us. For me, the most important thing has always been the DataFam. As a Social Ambassador, my mission is to spread Tableau's worldview to the DataFam and future DataFam, and I want to confidently talk about the future of Tableau Creators, where DataFam can passionately and safely engage. The reason I'm starting this on such an emotional note is because I know not all DataFam members will resonate with what I'm about to say. So, I wanted to have this conversation in an intimate and comforting atmosphere, like sitting side by side on the beach in San Diego, watching the soft sunset. Now, let's talk about our future.

The Era of "True" Self-Service BI is Coming
Pulse is intriguing. It's not just a feature; the reactions of Tableau users to Pulse are starkly divided into positive and negative. At first, I didn't understand why. I couldn't define the unusual stir within the DataFam. However, through my own emotional turmoil and conversations with my peers, I reached a conclusion. The difference lies in whether one is excited or anxious about the possibility that the original vision of self-service BI—where data visualization is something we do ourselves, not something done for us—might finally be realized.
In the near future, the responsibility of visual analysis might shift from data professionals to business decision-makers (LOB).
The Cycle and Players of Visual Analysis
The Cycle of Visual Analysis (https://help.tableau.com/current/blueprint/en-us/bp_cycle_of_visual_analysis.htm) is part of Tableau Blueprint, representing best practices in the visual analysis process.
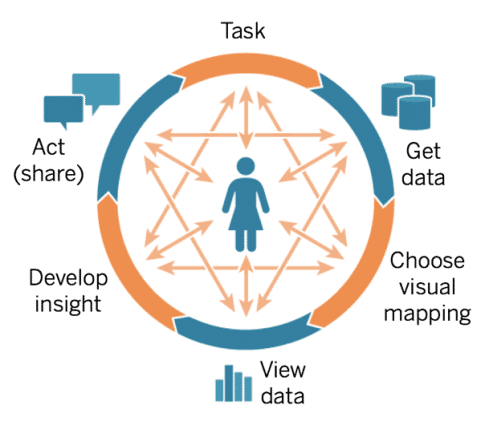
Some readers might have been taught that Tableau Creators should handle all steps of this cycle. While this is the ideal scenario, reality differs. In practice, ownership is often divided as shown in this diagram:
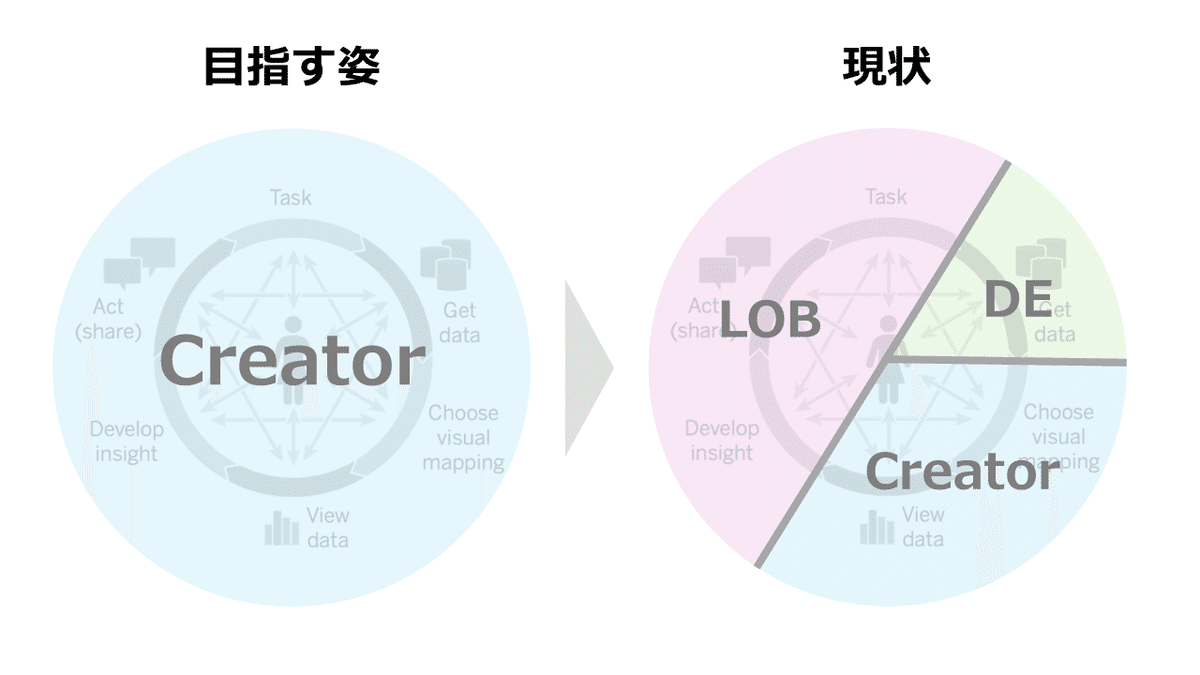
Tableau Creator (Data Visualization Worker)
Choose visual mapping
View data
LOB (Business Decision Makers)
Task
Develop insight
Act
Data Engineer (DE: Data Preparation Specialist)
Get data
The high specialization of skills from "Get data" to "View data" requires significant time and financial resources for learning, which is burdensome for LOB decision-makers with their primary jobs. Thus, they tend to outsource these tasks to specialists (either in-house or external). There's a high demand for dashboard creation. However, there are not enough matured data analysts capable of handling the entire visual analysis cycle on their own. As a result, many Tableau Creators emerge, performing the tasks of building dashboards according to LOB instructions within the functionalities of Tableau Desktop, without a holistic understanding of the cycle. AI could potentially change this structure. Particularly, the AI functions within Tableau provide strong support for "Choose visual mapping" and "View data," tasks traditionally assigned to Tableau Creators. Could we start seeing LOBs tackling visualization tasks themselves with AI support, rather than relying on Tableau Creators?
The Real Value AI Brings to Visual Analysis: Streamlining and Accelerating the Analysis Process through Shifting Responsibility
Indeed, AI brings value by reducing the resources and time required for visualization. However, I believe the greatest value AI brings to visual analysis is the streamlining of the analysis process through the integration of visual analysis stakeholders, which in turn accelerates the analysis cycle. As mentioned earlier, three stakeholders are involved in visual analysis:
Tableau Creator
LOB
Data Engineer
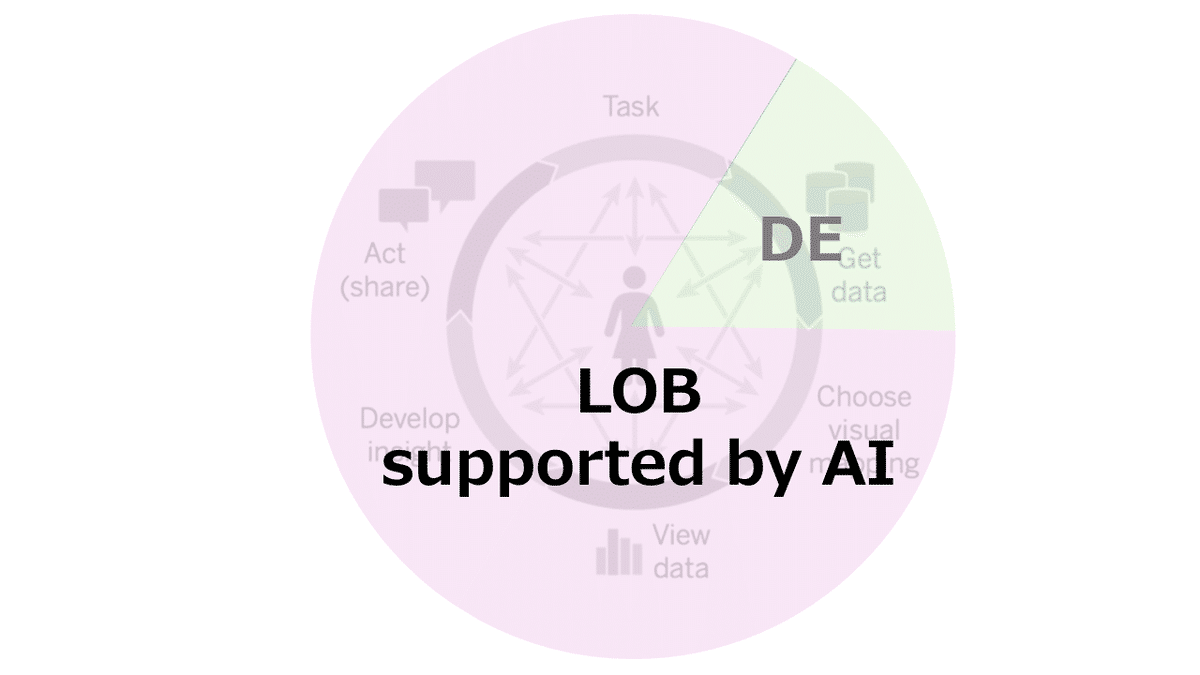
With the rise of AI, the primary actor in visual analysis will shift to LOB supported by AI. Consequently, the structure of visual analysis will simplify to:
LOB supported by AI
Data Engineer
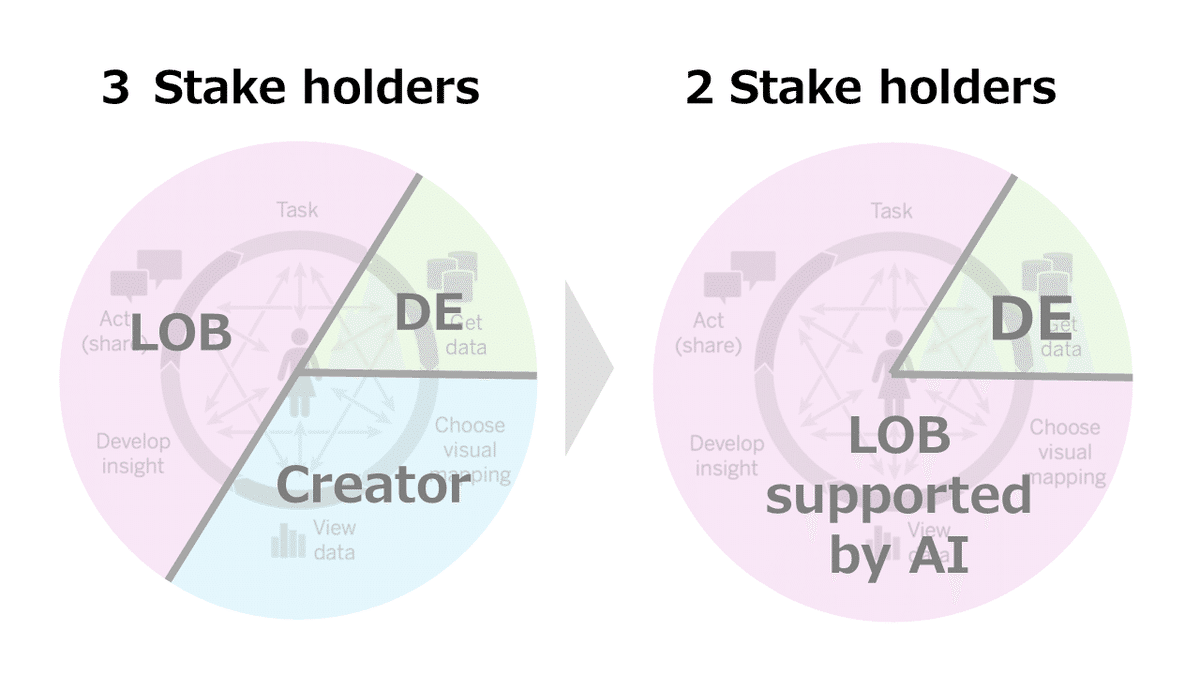
You might ask, "Won't Data Engineers be integrated as well?" I believe it will take a bit more time to reach the level where tasks can be fully supported by AI (honestly, it would be most beneficial if AI could handle this part). The reason is that the task of Data Engineers, "Get data," heavily involves human judgment and systematization. So why does a streamlined visual analysis structure speed up the analysis cycle?
Because everything, except "Get data," is done by one person.
I believe that the quickest way to complete visual analysis, apart from setting the hypothesis (Task setting), is through the trial and error of a single individual. Ultimately, the key to improving the proficiency of visual analysis is how quickly and frequently one can execute thinking, action, and verification based on appropriate hypotheses. If the cycle is interrupted, leading to waiting times or a handover to others that lowers resolution, it becomes inefficient. The most significant waste is spending too much time on analysis without taking action.
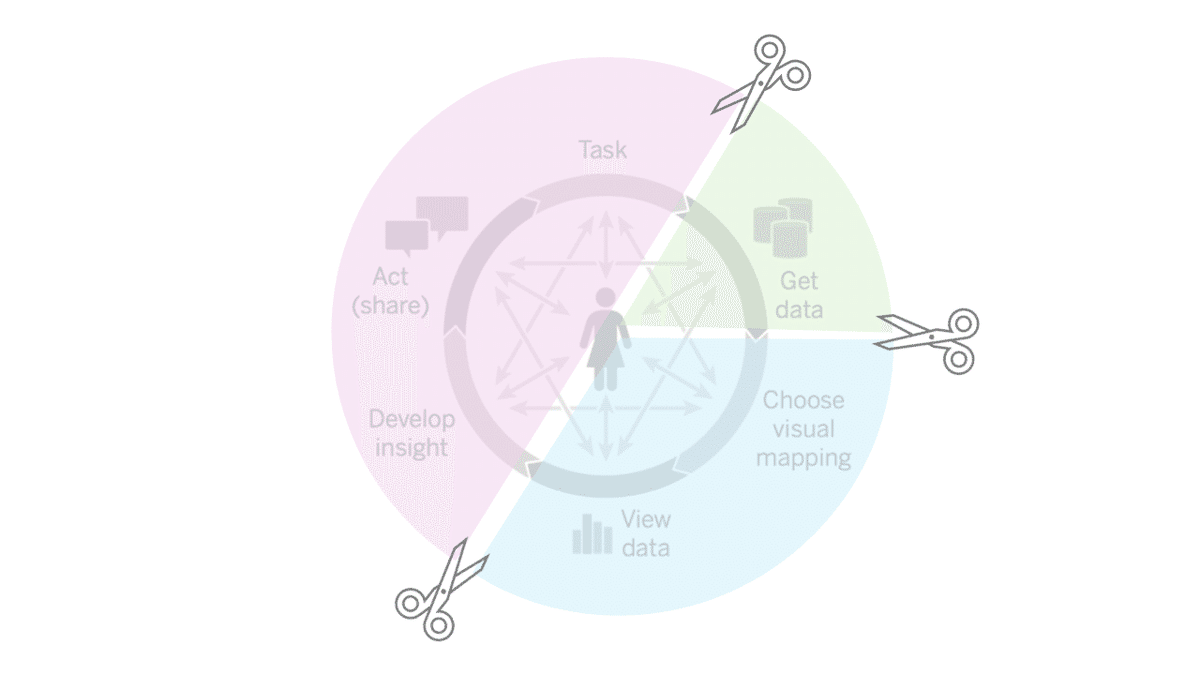
Tableau advocates "flowing analysis" for this reason. The key is context. Insights are only gained when hypotheses, datasets, and visuals are understood in connection. In hindsight, I was very fortunate. My main job was not "data analysis," but as a merchandiser in the food industry who made decisions based on data, so the idea of handing off parts of the cycle to others never occurred to me. I analyzed data because I had an urgent need to "fill the gap of decision-making without evidence with data" and a strict rule that "reports based on data were necessary for approvals, without which superiors would never sign off." The value of going through the process of analyzing and deciding based on data, even if the decision turned out to be wrong, was already ingrained as a norm. I recently realized that this was a true data-driven management style, seen firsthand by only a select few, and the standard practice of advanced companies like Amazon.
Therefore, as a decision-maker who loves self-service BI, I want to support this "do-it-all-yourself" approach as the future vision of BI.
Is the Change in Analysis Responsibility Negative for Tableau Creators?
So, if the primary responsibility for visual analysis shifts from Tableau Creators to LOB, is it a negative thing for Tableau Creators? Initially, I was scared. The people who used to ask me to create dashboards would now make them themselves. I feared my job would disappear. However, through conversations with Ambassadors and leaders in the Data field, both domestically and internationally, my perspective gradually changed. This is an opportunity. An unprecedented opportunity for us and our organizations to grow. We are merely afraid of change. We are just frozen in the face of suddenly opened possibilities.
Moving Away from "Doing it for Others": Tableau Creators as Enablers
What does it mean for the responsibility of visual analysis to shift to the business side (LOB)? It means that soon, there will be a large number of beginners in visual analysis. Even with AI support, it's not perfect. I believe Tableau Creators should become the teachers who help these people become proficient. There is a basis for this. Over the past year, as I have engaged in cross-community interactions with experts and leaders in data engineering and data science, I have become convinced that Tableau Creators have a clear strength. Tableau Creators, and BI specialists in general, have significantly better communication skills compared to other data professionals. This is understandable, as Tableau Creators work closely with decision-makers and collaborate on outputs more than any other data technology implementers. Of course, data engineers and data scientists also interact with decision-makers, but their outputs, such as data pipelines, architecture designs, and predictive models, are produced at a slightly further distance from decision-makers compared to the dashboards we create. This naturally reduces the amount and quality of communication and makes it less frequent. On the other hand, Tableau Creators’ outputs, like dashboards, directly reach decision-makers’ eyes, allowing us to communicate using the same visuals and terminology, resulting in higher quality and more frequent interactions and experience. This is significant. However, we have not fully leveraged this wonderful characteristic. Until now, many of us Tableau Creators have spent much of our resources on the task of "creating on behalf of others."
From now on, we must evolve into enablers who support passionate analysts willing to take on visual analysis themselves, with higher and broader expertise and leadership. Otherwise, this spark of passion will die out. Let’s graduate from "doing it for others." Let’s exercise leadership, inventory our own capabilities to see if there are any skills that can be utilized to benefit the people and organizations around us, and then apply them. Skills are recognized only when they are used and observed within a group. Let’s show the world your talents.
The Multi-Talented Tableau Creator
As Tableau Creators transition from hands-on work to enablers, they should possess "higher and broader expertise." What exactly is a Tableau Creator? Are they BI Engineers? Data Visualization Specialists? The Japanese Digital Agency has even established a position called Data Storyteller, but fundamentally, I believe Tableau Creators are "Data Analysts." The Data Analysts I envision are those who generate value through data analysis, and among them, BI Engineers and Data Visualization Specialists are particularly adept at visual analysis. Tableau Creators, then, are Data Analysts who use Tableau for visual analysis. Thus, our scope is relatively narrow.
On the other hand, data-driven management requires a wide range of skills and positions, such as:
Business Analyst
Data Strategist
Data Engineer
Platform Engineer
Data Scientist
Data Analyst
Project Manager
...
Additionally, there are managerial roles like CDO, CDAIO, and various other managers, each with their own areas of expertise and responsibility. In the past, it was challenging for one person to possess multiple areas of expertise. However, technological advancements are expanding the scope of specialized tasks, not only in data visualization but also in data engineering and data science. Fully managed platforms and AutoML are examples of this.
Just as Tableau expanded our possibilities with its drag-and-drop features, making us feel like we could achieve more, similar advancements are happening in other data fields. The trend in data utilization is moving toward advanced analytics and more sophisticated analysis. The concept of Tableau +1, where we expand our expertise, can lead Tableau Creators to a broader future. As a consultant, I've benefited greatly from expertise outside of Tableau. Your new skills can also be a great asset to you.
The Concept of Tableau +1: Building a Multi-Talent House with Pillars of Skills
Promoting Tableau +1 does not mean recommending a job change. I'm not suggesting that BI Engineers should become Data Scientists. In reality, few professionals rely solely on one area of expertise, much like aiming to become a professional pianist. The idea of Tableau +1 is to build a sturdy house with a roof supported by multiple pillars of expertise, creating a secure foundation. This approach ultimately enhances the overall depth of your skills and allows for synergistic effects among different capabilities.
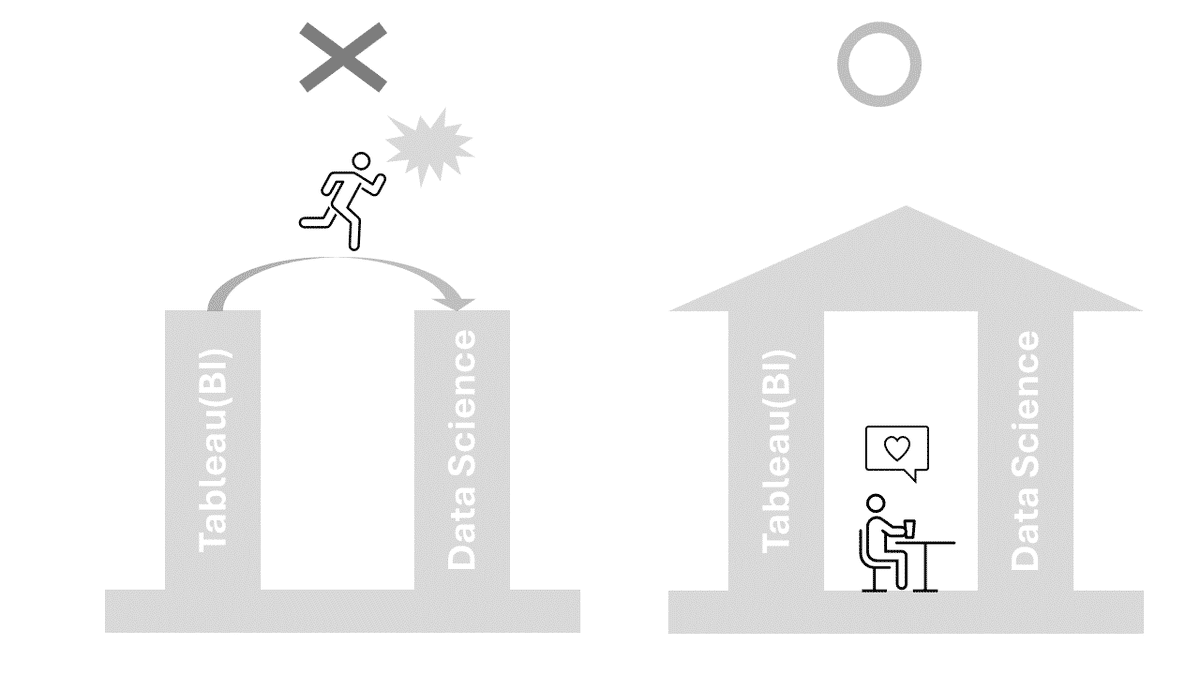
The way to build this robust multi-talent house varies from person to person, and the appearance of the house will be different for everyone. However, some guidelines can be offered for those embarking on this challenge:
Tableau + AI/ML
If you aim to mature as a Data Analyst by acquiring advanced analytics skills, Tableau + AI/ML is a good direction. While the demand for advanced analytics using AI/ML is increasing, there is a shortage of skilled analysts. Aspiring to be a Data Scientist requires advanced knowledge and coding skills, but we aim to build an additional pillar next to BI. Using tools like AutoML (Dataiku, DataRobot, Amazon SageMaker, Google Vertex AI), you can imagine creating dashboards that incorporate predictive models you built. Citizen Data Scientists can serve as role models for the Tableau + AI/ML approach.
Tableau + DE (Data Engineering)
If you ask for my recommendation, this is the one I advocate the most. The growing demand for advanced analytics means data must be obtained and utilized in a state that meets these advanced requirements. This involves building data marts, data modeling, ETL, and data pipelines—areas typically handled by Data Engineers. Although traditionally challenging for Tableau Creators to enter due to the need for high expertise and coding skills, user-friendly fully managed platforms (like Snowflake) and data transformation tools (like dbt) have made it more accessible with fewer learning resources.
Some BI Engineers might already be involved in data mart construction, data modeling, and ETL. In many organizations, BI Engineers' capabilities include data modeling and data mart construction. It’s common to have Data Engineers handle tasks up to the data warehouse (DWH) stage, while BI Engineers manage the optimization of datasets within the DWH. This is the ideal role for a BI Engineer. "Get Data" should be part of our job. Analytics Engineers can serve as a reference.
Another advantage of Tableau + DE is that it aligns seamlessly with the Tableau product suite.
At the Tableau Conference 2024, the concept of "Analytic Canvas," a new workspace for Data People, was introduced. This resonated with me as a new image of Tableau Creators, reaffirming the need for Data Engineering skills within the Tableau product ecosystem. Therefore, if you are to add a new skill, this should be the first.
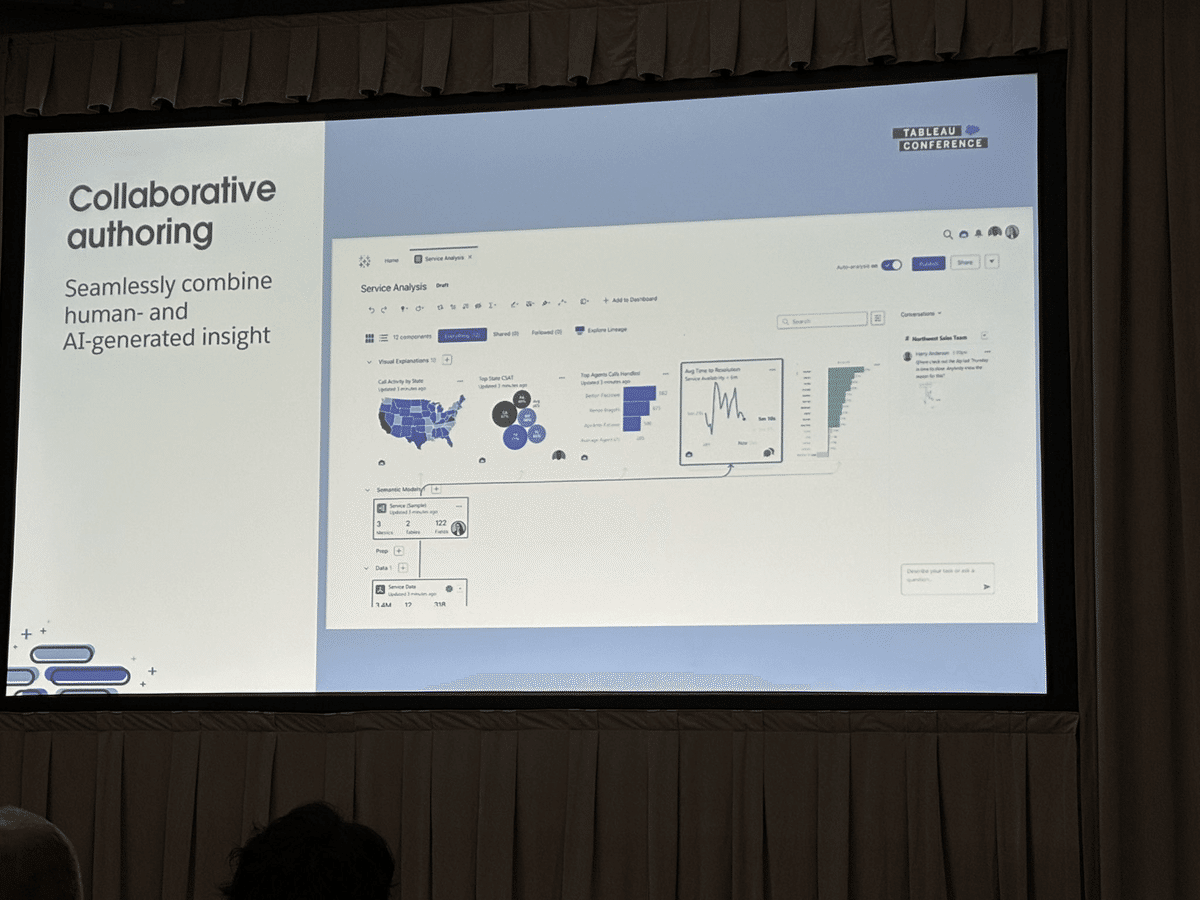
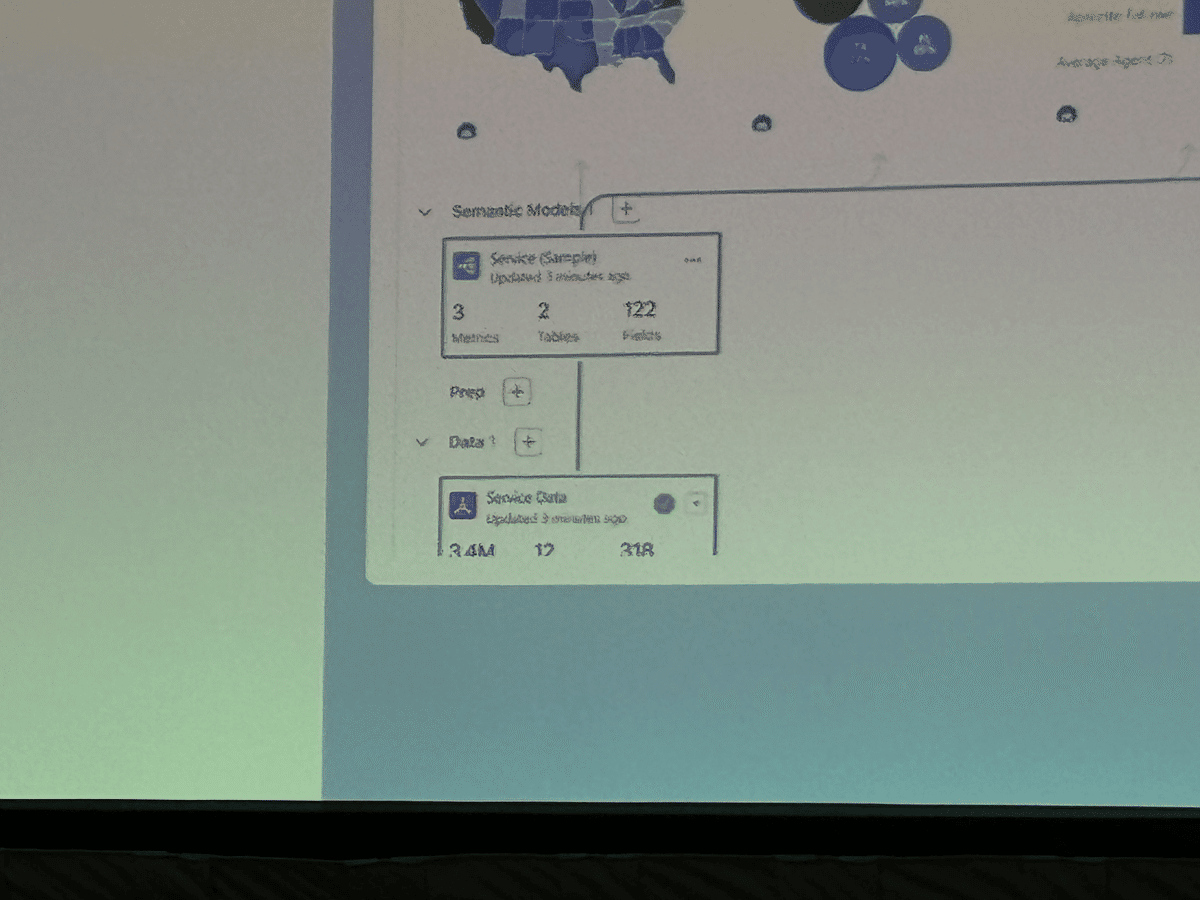
A brief explanation of the "Analytic Canvas" workspace: It seamlessly integrates data preparation, modeling, and visualization in a lineage-like view, emphasizing not just the final dashboard but the entire process. After connecting to a data source, a semantic model is constructed, which serves as the basis for both AI-based and manual visualizations, making it a very modern workspace. Recently, I've noticed this Canvas-style workspace in platforms like Google and Snowflake as well. It might be a trend.
In any case, BI engineers cannot escape from the data mart and semantic layer. It is more natural and efficient to master these as the foundational pillars supporting BI.
Tableau + DM (Data Management)
So far, we've discussed capabilities that produce outputs using data. However, as mentioned in the context of Tableau + DE, merely having data engineering is insufficient for creating a state where data can be obtained and utilized for advanced analytical requirements. Data management is crucial for maximizing the effectiveness of data analytics. I especially want Tableau Creators to focus on the role of Data Stewards. Data Stewards manage metadata and operate data catalogs, essentially registering and managing the specifications and meanings of the data in an understandable way for everyone.
For example, they register metadata like "Flag 1 means male, Flag 2 means female" in a data catalog for everyone to see. This role is vital because without understanding such metadata, insights cannot be derived. Yet, most metadata, particularly business metadata, is tacit knowledge stored in analysts' minds, leading to inefficient and undemocratic operations where people have to find the "right person" to ask.
Data Stewards’ tasks suit data analysts like Tableau Creators, who understand the data and derive insights from it. Properly registering and managing metadata would save us and our peers the trouble of searching for specifications or knowledgeable individuals. Engaging motivated individuals in this role creates a robust system. I encourage Tableau Creators to take an interest in becoming Data Stewards.
Tableau + Leadership
Finally, the most challenging but exciting skill. Over the past year, as I've worked as a community leader, believing in my role of guiding peers, I've realized one thing: the data field suffers from a chronic lack of leadership. There are various reasons for this, such as conservative IT KPIs that discourage innovative thinking and strong vendor dependencies.
I don’t know what department or job you currently have, but if you are passionate about data analysis and engage in it daily, I urge you to showcase your work to your organization. Organizations are hungry for leaders and won't overlook those with the potential. Honestly, I'm not exceptionally skilled as a Data Visualization Specialist. I'm just a bit (or perhaps quite) audacious and good at showing my work to others.
Data utilization cannot create impact without scaling. If your organization recognizes your passion and achievements, granting you more influence, you can pave the way as an enabler and leader in data utilization. This applies to roles in corporate planning, enterprise IT, CoE, and other company-wide positions.
One day, seeing a CDO, CDAIO, or CTO emerge from Tableau Creators would be incredibly cool! It’s a difficult path, but I hope to see this world with everyone someday.
For Those Feeling Lost on What to Do Next
Even if you are left wondering what to do starting tomorrow, rely on the community. Over the past year, there were many times I felt lost, struggled, and worried as a community leader. But advice from members and leaders of various communities, not just Tableau, has always saved me, giving me the courage to keep thinking without giving up.
If you are feeling lost right now, find role models within the community. We, the community leaders, will each serve as different types of role models for the new era of Tableau Creators. We continue to lead lightly on the cutting edge. Although I haven't confirmed with each one, I’m sure other leaders feel the same (so I’ll boldly speak for them).
Therefore, be more interested in new things, unknown things, unknown people, and possibilities beyond your recognition. Crossing community boundaries makes this possible. Please give it a try.
Now, let's talk with us about your future.

この記事が気に入ったらサポートをしてみませんか?