30DayChartChallengeでデータビジュアライゼーションの作品を作る

こちらのアカウントの方が開催している30DayChartChallengeに参加している。
📢 1 day left! Are you really prepared? 😁
— #30DayChartChallenge (@30DayChartChall) March 31, 2022
In the meantime, here you have again all the prompts for the 30 days. More information on data resources and chart types you will find on GitHub: https://t.co/yZG79Crt4K
Let us know if you have any further questions! 🙂 pic.twitter.com/kIItwxXrTZ
基本的に英語圏らしいので、英語で作ることにした。日本語版と作品制作の意図などは、別の機会に出す。
毎日一枚ずつ作るのは正直きついが、解像度が上がるので強制的なレベルアップの機会としては良いなと思った
#day1
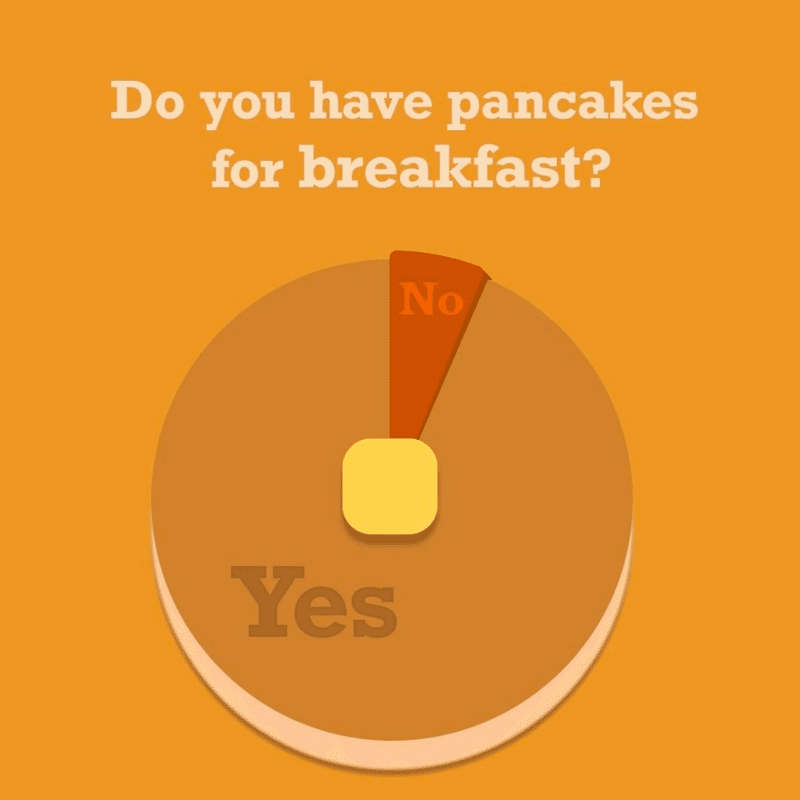
Day2

Day3

エンジニアとして働いている成長記録やおもしろいと思ったこと色々書いていこうとおもいます 頂いたご支援は、資料や勉強のための本、次のネタのための資金にし、さらに面白いことを発信するために使います 応援おねがいします