センサの出力値を上手に保存する #1

1.目的
今回の目的はセンサで得た値を配列に保存した後、matplotlibを用いてグラフに出力する。その後、グラフをgifで保存する。ここまでをpythonプログラムで行いたい。
2.準備
環境はWindows PCでVisual Studio CodeとUbuntuでPythonプログラムを実行する。Pythonのバージョンは3.10.3。
尚、今回はCUI環境(Ubuntu)でプログラムを実行するため、グラフの表示は行わず、ファイルの保存により結果を確認する。
3.グラフ作成
まずグラフを作成する。2つの1次元配列を用意する。片方は値を読み取った時間として0.2刻みの配列にする。もう片方は読み取った値と仮定し、乱数を格納する。
import numpy as np
import matplotlib.pyplot as plt
import matplotlib.animation as animation

pi = float(3.14159265358979)
s_t = float(0.2) #サンプリング時間
i = float(0)
t = []
result = []

fig = plt.figure()
#ax = plt.subplot(1,1,1)

while True:
   t.append(i*0.2)
   result.append(np.random.uniform(-1,1))
   if i>=10:
       break
   i=i+1

plt.plot(t,result)
fig.savefig("test.png")
図1 プログラム1
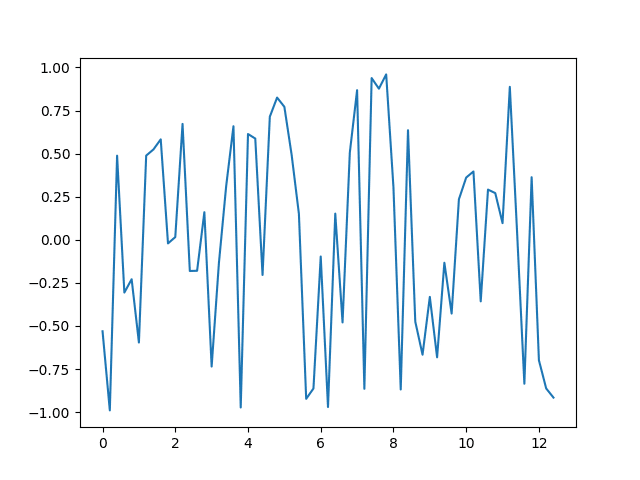
図2 プログラム1の結果
ついでに2つ同時に出力する。
import math
import numpy as np
import matplotlib.pyplot as plt
import matplotlib.animation as animation

pi = float(3.14159265358979)
s_t = float(0.2) #サンプリング時間
i = float(0)
t = []
result = []
y = []

fig = plt.figure()
ax = plt.subplot(1,1,1)

while True:
   t.append(i*0.2)
   result.append(np.random.uniform(-1,1))
   y.append(math.sin(i*0.2))
   if i>=62:
       break
   i=i+1

ax.plot(t,result)
ax.plot(t,y)
fig.savefig("test.png")
図3 プログラム2
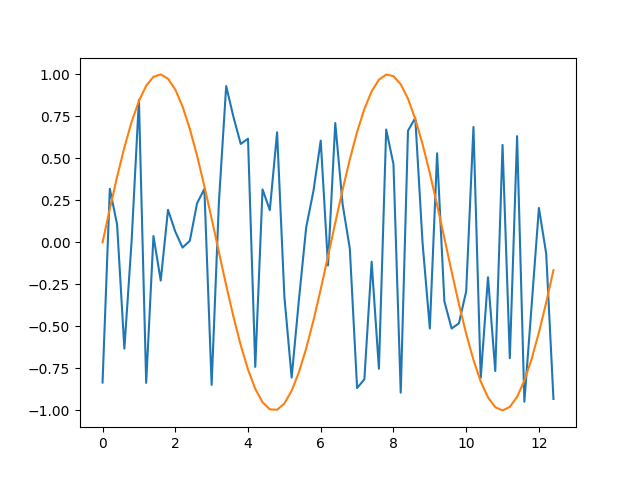
図4 プログラム2の結果
複数のplotを行う際はsubplotを図2のように使い、axにplotを行う。すると何やらうまくいく。subplotの引数は1*1の1番目という意味だそうだ。
横向きに2画面で出力もしてみよう。
import math
import numpy as np
import matplotlib.pyplot as plt
import matplotlib.animation as animation

pi = float(3.14159265358979)
s_t = float(0.2) #サンプリング時間
i = float(0)
t = []
result = []
y = []

fig = plt.figure()
ax1 = plt.subplot(1,2,1)
ax2 = plt.subplot(1,2,2)

while True:
   t.append(i*0.2)
   result.append(np.random.uniform(-1,1))
   y.append(math.sin(i*0.2))
   if i>=62:
       break
   i=i+1

ax1.plot(t,result)
ax2.plot(t,y)
fig.savefig("test.png")
図5 プログラム3
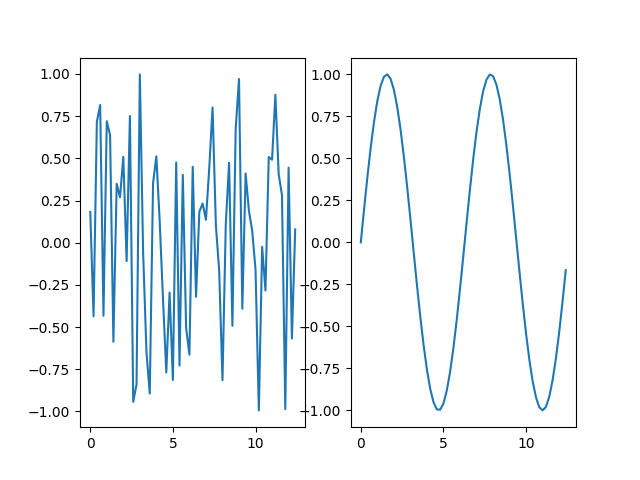
図6 プログラム3の結果
プログラム2と違うのは、axをax1とax2に分けてそれぞれsubplotし、plotも別々に行った。subplotの変数を変えることで2つのグラフの配置を変えることもできる。
4.アニメーション
アニメーションを作るにあたって、普通に考えれば、というか調べればmatplotlib.animationのFuncAnimationを使うのだろうが、この記事を書いている間に一つ閃いた。
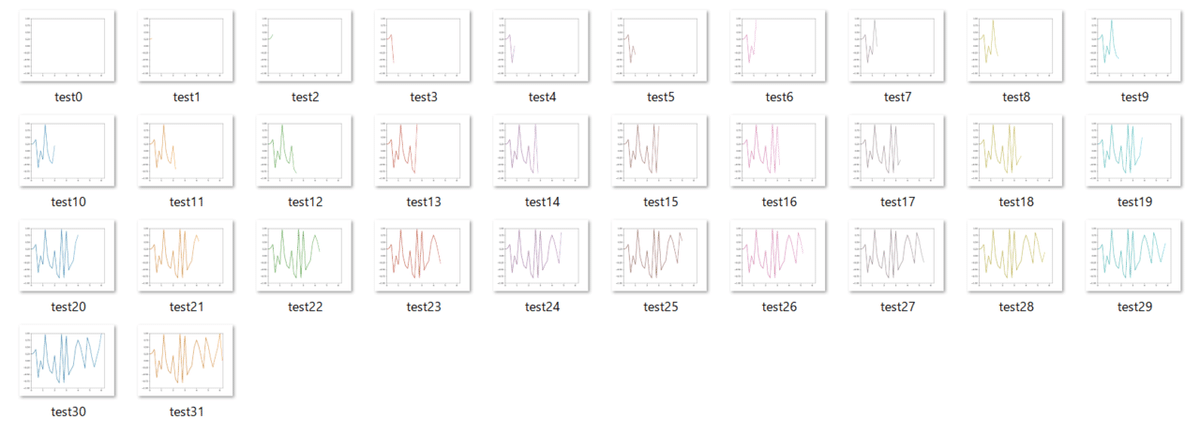
図7 1ループごとに画像を保存
この画像をつなぎ合わせてgifになると思うのだ。なるだろう!やってみよう!
import math
from pickletools import optimize
import numpy as np
import matplotlib.pyplot as plt
import matplotlib.animation as animation
from PIL import Image
pi = float(3.14159265358979)
s_t = float(0.2) #サンプリング時間
i = int(0)
t = []
result = []
imgs = []

fig = plt.figure()
ax = plt.subplot(1,1,1)
ax.set_xlim(0,6.28)
ax.set_ylim(-1,1)

while True:
   t.append(i*0.2)
   result.append(np.random.uniform(-1,1))
   ax.plot(t,result)
   fig.savefig("data/test"+str(i)+".png")
   img = Image.open("data/test"+str(i)+".png")
   imgs.append(img)
   if i>=31:
       break
   i=i+1

imgs[0].save("animation.gif", save_all=True, append_images=imgs[1:], optimize=False, duration=100, loop=0)
図8 プログラム4
図9 プログラム4の結果
ループ内にsavefigを記述したため、画像が逐一保存される。それをループが終了し、プログラムが終了する直前にgifにする。
画像配列を作成し、はじめの一つにPillowライブラリのsaveを適用し、第3引数でそれ以降の要素を指定する。第5引数のdurationは一枚あたりの表示時間をミリ秒で指定できる。loopという変数は0に設定すると無限ループになる。
5.おわりに
このくらいでおそらくセンサの値を上手に処理できるのではないかと思う。アニメーションをFuncAnimationで作るのもやっておいた方がよいのかもしれない。いつかやろうかな。多分しません。僕そっちの専門家じゃないので。
この記事が気に入ったらサポートをしてみませんか?