
KDB and q documentation "Q for quants"の和訳①

元ネタ↑
Kdb+ is a powerful database that can be used for streaming, real-time and historical data. Q is the SQL-like, general-purpose programming language built on top of kdb+. It offers high-performance, in-database analytic capabilities.
KDB+ はリアルタイムデータにも過去データにも利用できるパワフルなデータベースである。QはSQLライクな言語で、KDB+をベースに作られた汎用プログラミング言語である。Qはハイパフォーマンスであり、データベース内分析を可能にする。
in-database:何これ造語?インメモリデータベースだからメモリ上に取り込んだデータをそのまま分析できるっていうニュアンス?
qの起動
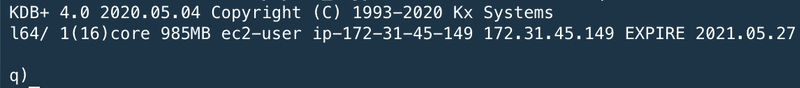
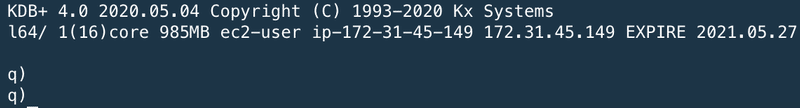
At the shell prompt, type q to start a q console session, where the prompt q) will appear.
シェルプロンプトで"q"をタイプし、qコンソールセッションを開始する。プロンプトに"q)"が表示される。
※プロンプトの内容はページサンプルではなく実際の打鍵結果を貼り付ける
テーブルのcreate
To begin learning q, we will create a simple table. To do this, type or copy the code below into your q session. (Don’t copy or type the q) prompt.)
qの学習を始めるにあたり、シンプルなテーブルをクリエイトしてみようと思う。これに際し、以下に記載のコードをqセッションにタイプするかコピーする。("q)"はコピーしないように注意)
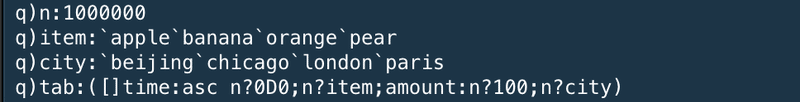
These expressions create a table called tab which contains a million rows and 4 columns of random time-series sales data. (For now, understanding these lines of code is not important.)
これらのコマンドは、"tab"という名称で100万の行、4つのカラム、ランダムなタイムシリーズのセールスデータを持つテーブルをcreateする。(今時点では、コードの意味を理解することは重要ではない)
シンプルなクエリ
The first query we run selects all rows from the table where the item sold is a banana.
最初に発行するクエリは、"banana"を売った全ての明細をテーブルからselectするというものだ。
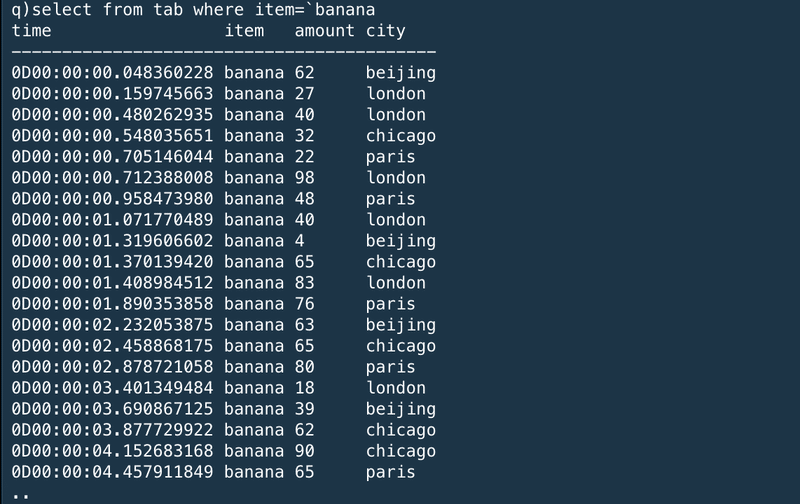
Notice all columns in the table are returned in the result when no column is explicitly mentioned.
カラムが明示的に指定されない場合、全てのカラムが結果として返ってくることに注意。
統計クエリ
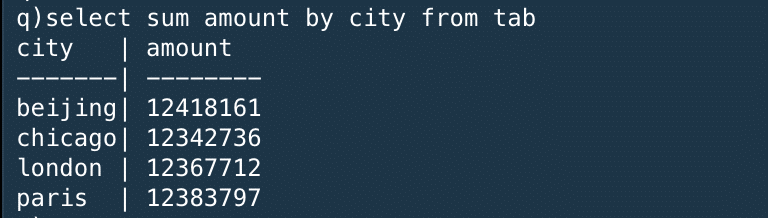
The next query calculates the sum of the amounts sold of all items by each city.
次のクエリは、全てのアイテムが売れた個数の合計を街ごとに計算するものだ。
※select の*がいらなかったり、group byじゃなくてbyでよかったり、sqlよりもシンプルになっているイメージ
This uses the aggregate function sum within the q language. Notice this returns a keyed table where the key column is city. This key column is sorted in alphabetical order.
これはq言語の統計関数である"sum"を利用している。返り値は"city"をキーにしたキーテーブルである。このキーカラムはアルファベット順にソートされている。
時系列統計クエリ
The following query shows the sum of the amount of each item sold by hour during the day.
次のクエリはそれぞれのアイテムが1時間に売れた数の合計を1日分表示するものだ。
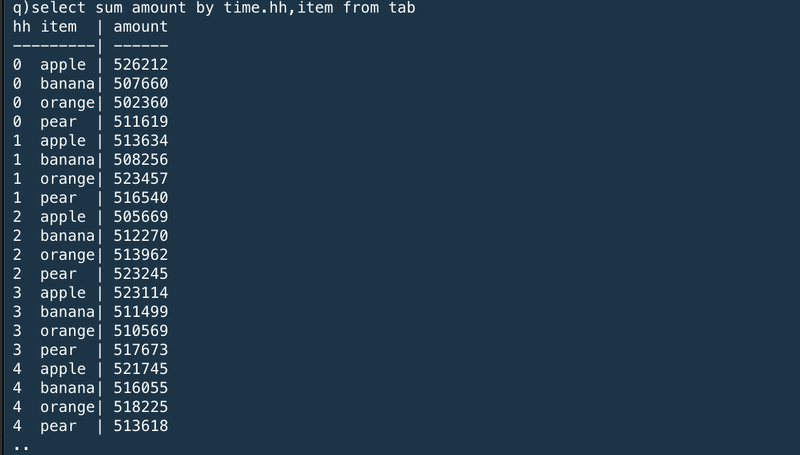
The result is a keyed table with two key columns, hh for the hour and item. The results are ordered by the keyed columns. The query extracts the hour portion from the nanosecond-precision time column by adding a .hh to the column name.
結果は、1時間ごとに区切られた"hh"とアイテムの2つのキーカラムを持ったキーテーブルだ。結果はキーカラムでソートされている。クエリは".hh"を列名に追加することにより、ナノ秒精度で1時間分を抽出する。
Congratulations, you created and queried your first q table!
おめでとう。あなたは最初のテーブルをcreateし、最初のクエリを発行した。
インメモリクエリ
This tutorial shows you q in action on some randomly-generated in-memory data. If you are new to q you won’t understand all the syntax – but you can get a flavour of the language and its performance.
このチュートリアルでは、qがいくつかのインメモリデータをランダムに生成するのを紹介する。もしあなたがqの初心者の場合、すべてのシンタックスを理解することはできないかもしれないが、q言語のパフォーマンスを感じてもらえるだろう。
You can run each of these queries in the free versions of kdb+. You can paste each line of code into a session and run it. To time the performance of an operation, \t.
あなたはこれから紹介するクエリを無料版のkdb+で実行することができる。それぞれのコードをqセッションにコピぺして実行することができる。実行時間を計測するために、"\t"を先頭に追加する。
q)\t select from table※サンプル
The dataset is from a fictional computer-monitoring application. A company owns a set of desktop computers and monitors the CPU usage minute by minute. Users of the desktop computers can register calls with a help desk if they hit problems.
データセットは架空のコンピュータモニタリングアプリケーションのものを使用する。会社が所有するデスクトップコンピュータのCPU利用率を毎分監視するというものだ。デスクトップコンピュータの利用者は問題に直面したときにヘルプデスクに連絡することができる。
If your computer has limited memory, it’s advisable to start q with the -g 1 command line flag to minimize memory use. You can also periodically invoke garbage collection with .Q.gc.
もし利用しているコンピュータのメモリが限られているならば、qセッションを"-g 1"コマンドを指定することでメモリ利用を最小化することが望ましい。また、".Q.gc"を利用することで定期的にガベージコレクションを実行することもできる。
※ -g 1をオプション指定して再起動
ランダムデータの生成
The script calls.q below will generate some semi-realistic random data. It is quite complex for beginners – don’t dwell on it!
以下に示す"calls.q"スクリプトは、いくつかの半現実的なランダムデータを生成する。データは初学者にとってはかなり複雑だが、そこにこだわらないで!
/ calls.q
/ Generate some random computer statistics (CPU usage only)
/ You can modify n (number of unique computers), timerange (how long the data is for)
/ freq (how often a computer publishes a statistic)
/ and calls (the number of logged calls)
n:1000; timerange:5D; freq:0D00:01; calls:3000
depts:`finance`packing`logistics`management`hoopjumping`trading`telesales
startcpu:(til n)!25+n?20
fcn:n*fc:`long$timerange%freq

computer:([]
   time:(-0D00:00:10 + fcn?0D00:00:20)+fcn#(.z.p - timerange)+freq*til fc;
   id:raze fc#'key startcpu
   )
computer:update `g#id from `time xasc update cpu:{
   100&3|startcpu[first x]+sums(count x)?-2 -1 -1 0 0 1 1 2
   }[id] by id from computer

/ Generate some random logged calls
calls:([]
   time:(.z.p - timerange)+asc calls?timerange;
   id:calls?key startcpu;
   severity:calls?1 2 3
   )

/ Create a lookup table of computer information
computerlookup:([id:key startcpu] dept:n?depts; os:n?`win7`win8`osx`vista)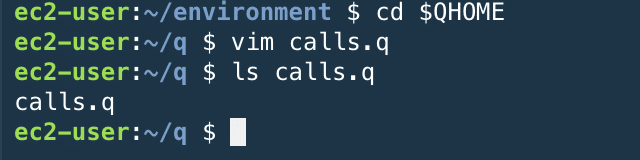
※配置完了
※通ったっぽい
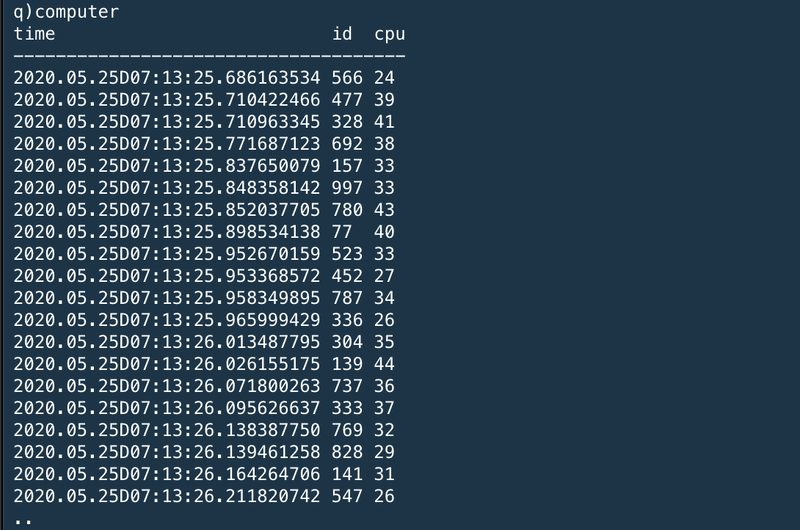
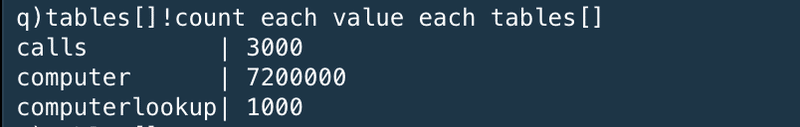
Each desktop reports its CPU usage every minute (the computer table). The CPU usage is a value between 3% and 100%, and moves by between -2 and +2 between each sample period. The data is generated over a 5-day period, for 1000 machines. You can modify the number of machines, time range and sample frequency.
それぞれのコンピュータはCPU利用率をコンピュータ内時刻の1分間隔でレポートする。CPU利用率は3%~100%の間をとる値であり、1サンプル期間ごとに-2~2に間で変動する。データは1000個のコンピュータの五日分のデーを生成している。あなたはマシン数や、時間間隔、サンプル間隔を修正することができる。
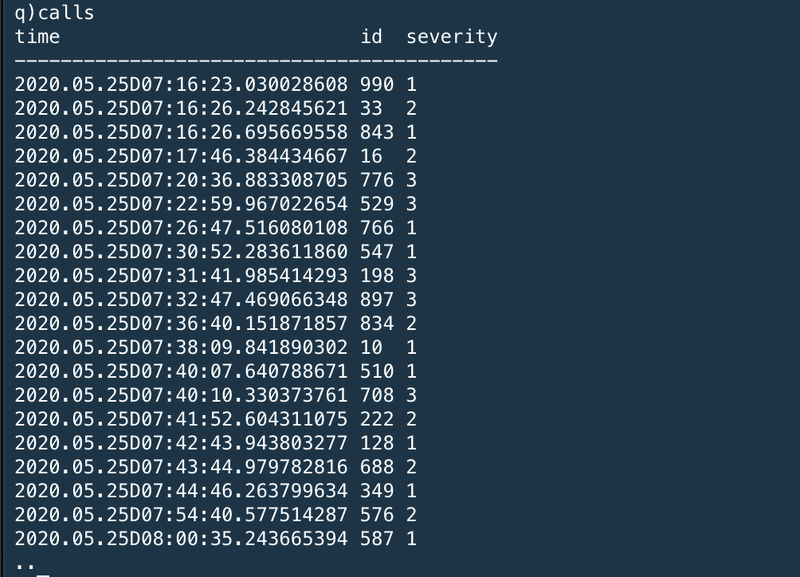
Call records (the calls table) are generated with a severity whenever a user reports a problem. A call record has different severity levels possible. 3000 call records are generated in the 5-day period.
コールレコード(calls table)はユーザがレポートした問題の重要度と共に生成されている。コールレコードは異なる重要度を持つことができる。3000個のコールレコードが五日分のデータの中で生成されている。
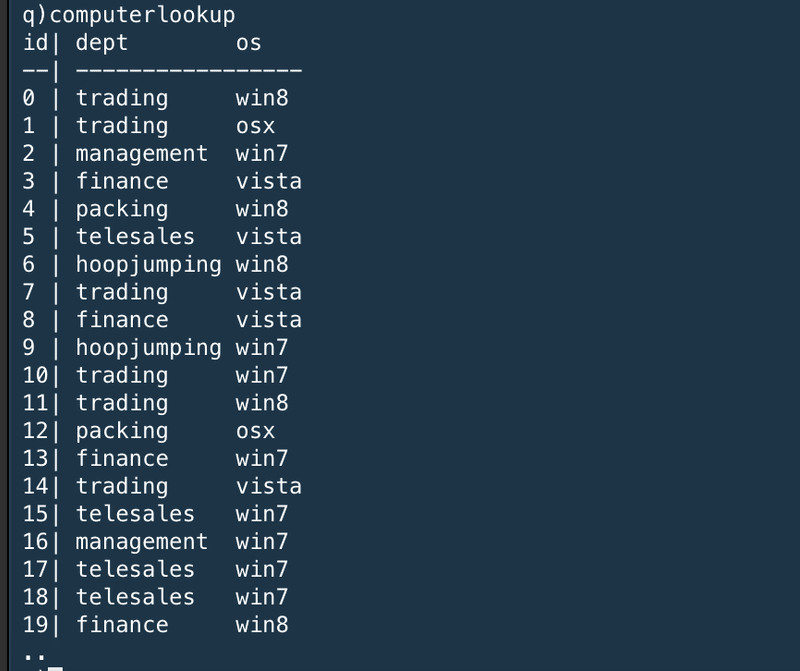
Static information (the computerlookup table) is stored about each desktop computer, keyed by id. Here, this is just the department the machine belongs to and the operating system.
静的情報(computerlookup table)はそれぞれのデスクトップコンピュータについて、キーである"id"でソートされている。ここでは、これは単にコンピュータが所属する部署とOSでしかない。
データオーバービュー
The generated data looks like this:
生成されたデータはこんな感じ
※超絶長いから一回切る
この記事が気に入ったらサポートをしてみませんか?