Runge-Kutta法についてのちょっとした解説

常微分方程式の初期値問題の数値計算において、比較的実装ロジックが単純である割に高精度である4段4次精度陽的Runge-Kutta法(RK4)が使われるケースが多い。基礎的なEuler法から始め、2~4段の陽的Runnge-Kutta法について、一般的なパラメータの条件を導出までを行っている解説です。
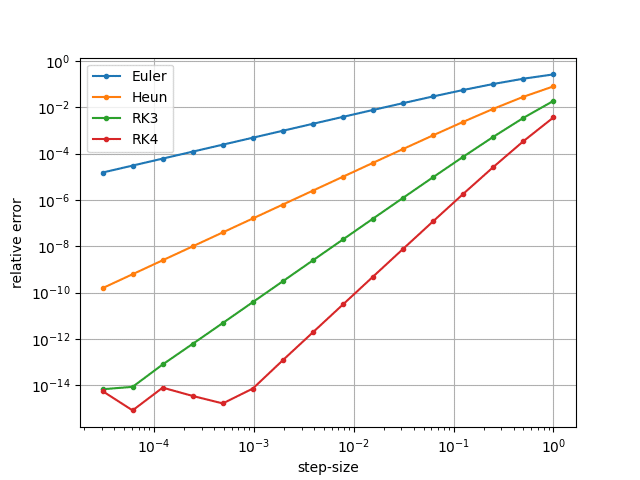
下図は各解法での刻み幅と相対誤差の関係。これのソースはさらにその下(Python)。
import numpy as np
import matplotlib.pyplot as plt

# ordinary differential equation
f = lambda x, y : y

# calculation section
x_0 = 0
x_n = 1

# initial value
y_0 = 1

# max number of steps: 2**(m-1)
m = 16

# store
step = np.empty(m)
err_eul = np.empty(m)
err_heu = np.empty(m)
err_rk3 = np.empty(m)
err_rk4 = np.empty(m)

# exact value
exact = np.exp(1)

# relative error
rel_err = lambda y : np.abs(y - exact)/exact

for j in range(m):
    # number of steps
    n = 2**j

    # step-size
    h = (x_n - x_0) / n

    x = x_0
    y_eul = y_0
    y_heu = y_0
    y_rk3 = y_0
    y_rk4 = y_0

    for i in range(n):

        # Euler's method
        k_1 = f(x, y_eul)
        y_eul += h*k_1

        # Heun's method
        k_1 = f(x    , y_heu        )
        k_2 = f(x + h, y_heu + h*k_1)
        y_heu += h*(k_1 + k_2)/2

        # RK3 method
        k_1 = f(x      , y_rk3                    )
        k_2 = f(x + h/2, y_rk3 + h*k_1/2          )
        k_3 = f(x + h  , y_rk3 - h*k_1   + 2*h*k_2)
        y_rk3 += h*(k_1 + 4*k_2 + k_3)/6

        # RK4 method
        k_1 = f(x      , y_rk4                            )
        k_2 = f(x + h/2, y_rk4 + h*k_1/2                  )
        k_3 = f(x + h/2, y_rk4           + h*k_2/2        )
        k_4 = f(x + h  , y_rk4                     + h*k_3)
        y_rk4 += h*(k_1 + 2*(k_2 + k_3) + k_4)/6

        x += h

    step[j] = h
    err_eul[j] = rel_err(y_eul)
    err_heu[j] = rel_err(y_heu)
    err_rk3[j] = rel_err(y_rk3)
    err_rk4[j] = rel_err(y_rk4)

# graph
plt.xscale("log")
plt.yscale("log")
plt.xlabel("step-size")
plt.ylabel("relative error")
plt.plot(step, err_eul, label="Euler", marker=".")
plt.plot(step, err_heu, label="Heun", marker=".")
plt.plot(step, err_rk3, label="RK3", marker=".")
plt.plot(step, err_rk4, label="RK4", marker=".")
plt.grid()
plt.legend()
plt.show()この記事が気に入ったらサポートをしてみませんか?