
【ごまかんぱちの挑戦】エクセルでAutoCADの自動作図(その7)

こんにちは。ごまかんぱちです。🐟
AutoCADの自動作図を目指して奮闘しています。
第7回の今回は、測量データを使って 何かしら描いていこうと思います。
7-1. 測量データ
こんな測量データがあるとします。
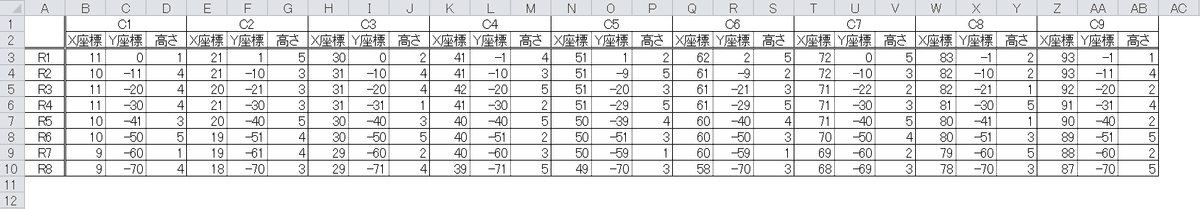
この例では、R1とC1が交わる場所の X座標は11、Y座標は0、その場所の高さは1 ということを表しています。
この測量データが表す平面図を自動で描いてみましょう。
一気にやると 頭が混乱するので、まずは1行だけ。
R1行目について、C1~C9列の座標を ポリラインで結んでいきましょう。
X座標とY座標を使います。
Print #1, "clayer Layer1"       '画層の指定

Print #1, "pline " & Cells(3, 2) & "," & Cells(3, 3) & " " & Cells(3, 5) & "," & Cells(3, 6) & " " & Cells(3, 8) & "," & Cells(3, 9) & " " & Cells(3, 11) & "," & Cells(3, 12) & " " & Cells(3, 14) & "," & Cells(3, 15) & " " & Cells(3, 17) & "," & Cells(3, 18) & " " & Cells(3, 20) & "," & Cells(3, 21) & " " & Cells(3, 23) & "," & Cells(3, 24) & " " & Cells(3, 26) & "," & Cells(3, 27) & " "
2行目はかなり長いですが、改行せずに一気に書きましょう。
実行するとこうなります。
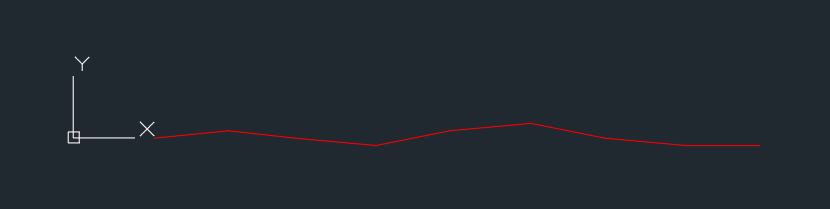
R1行目の座標を使って 描けました。😊
あとは、これを C1~C8 まで繰り返しましょう。
そう、for文の出番です。
Print #1, "clayer Layer1"       '画層の指定

For i = 3 To 10
    Print #1, "pline " & Cells(i, 2) & "," & Cells(i, 3) & " " & Cells(i, 5) & "," & Cells(i, 6) & " " & Cells(i, 8) & "," & Cells(i, 9) & " " & Cells(i, 11) & "," & Cells(i, 12) & " " & Cells(i, 14) & "," & Cells(i, 15) & " " & Cells(i, 17) & "," & Cells(i, 18) & " " & Cells(i, 20) & "," & Cells(i, 21) & " " & Cells(i, 23) & "," & Cells(i, 24) & " " & Cells(i, 26) & "," & Cells(i, 27) & " "
Next
R1行目からR8行目まで(3行目から10行目まで)繰り返しています。
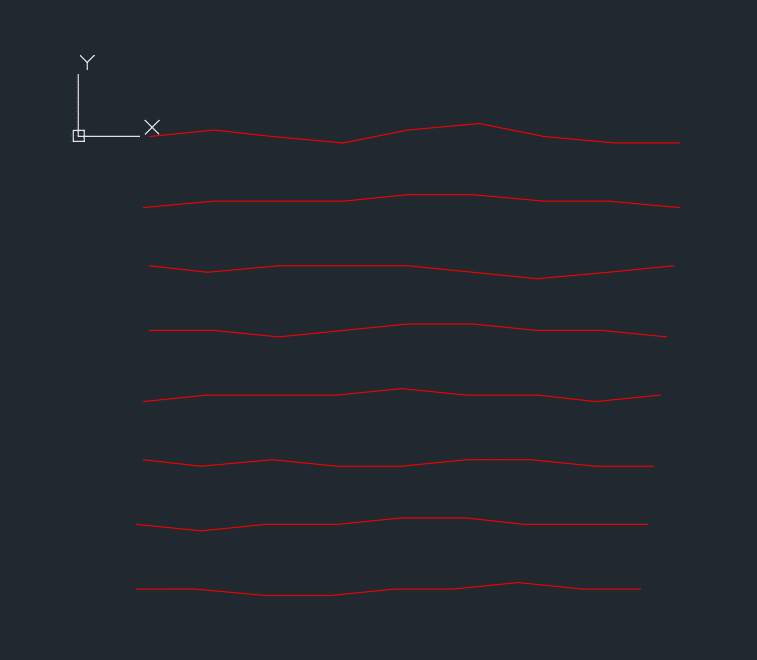
これで 横方向をポリラインで結ぶことができました。😊
続いて縦方向です。
Print #1, "clayer Layer1" '画層の指定
For i = 3 To 10
Print #1, "pline " & Cells(i, 2) & "," & Cells(i, 3) & " " & Cells(i, 5) & "," & Cells(i, 6) & " " & Cells(i, 8) & "," & Cells(i, 9) & " " & Cells(i, 11) & "," & Cells(i, 12) & " " & Cells(i, 14) & "," & Cells(i, 15) & " " & Cells(i, 17) & "," & Cells(i, 18) & " " & Cells(i, 20) & "," & Cells(i, 21) & " " & Cells(i, 23) & "," & Cells(i, 24) & " " & Cells(i, 26) & "," & Cells(i, 27) & " "
Next
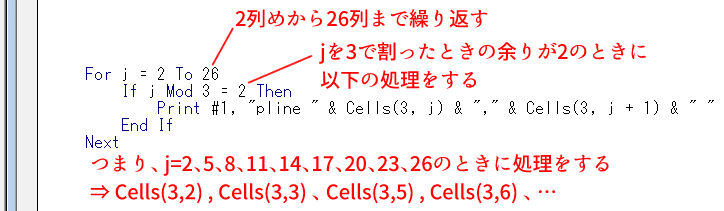
For j = 2 To 26
If j Mod 3 = 2 Then
Print #1, "pline " & Cells(3, j) & "," & Cells(3, j + 1) & " " & Cells(4, j) & "," & Cells(4, j + 1) & " " & Cells(5, j) & "," & Cells(5, j + 1) & " " & Cells(6, j) & "," & Cells(6, j + 1) & " " & Cells(7, j) & "," & Cells(7, j + 1) & " " & Cells(8, j) & "," & Cells(8, j + 1) & " " & Cells(9, j) & "," & Cells(9, j + 1) & " " & Cells(10, j) & "," & Cells(10, j + 1) & " "
End If
Nextこの測量データの形式は、C1列だけで エクセルを3列使っているので、少しテクニカルに対処します。
以下 解説です。
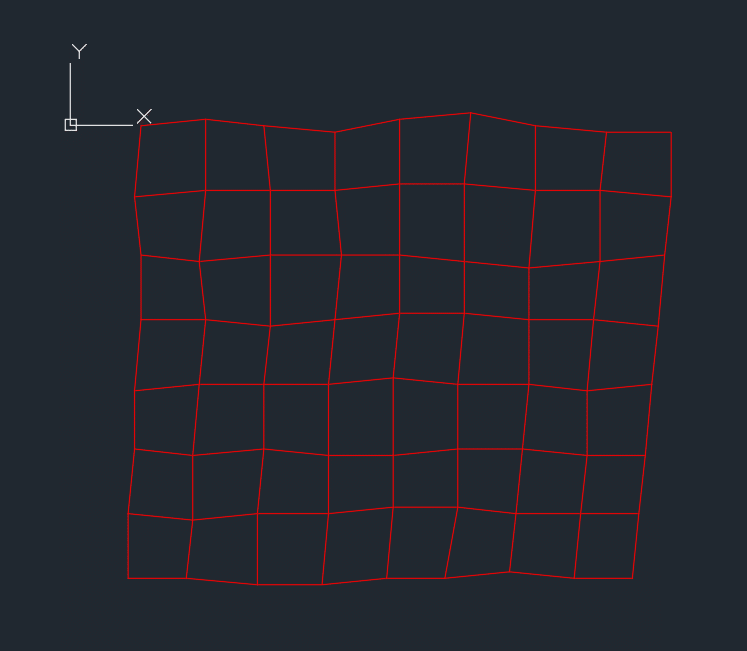
これで 隣り合った座標を結ぶ 平面図ができました。😊
続いて、R1やC1などの記号を追記します。
Print #1, "clayer Layer2"       '画層の指定

For i = 3 To 10
    Print #1, "line " & 0 & "," & Cells(i, 3) & " " & Cells(i, 2) - 1 & "," & Cells(i, 3) & " "
    Print #1, "circle " & -3.5 & "," & Cells(i, 3) & " " & 3.5
    Print #1, "text j mc " & -3.5 & "," & Cells(i, 3) & " " & 3.5 & " " & 0 & " " & Cells(i, 1)
Next

For j = 2 To 26
    If j Mod 3 = 2 Then
        Print #1, "line " & Cells(3, j) & "," & 10 & " " & Cells(3, j) & "," & Cells(3, j + 1) + 1 & " "
        Print #1, "circle " & Cells(3, j) & "," & 10 + 3.5 & " " & 3.5
        Print #1, "text j mc " & Cells(3, j) & "," & 10 + 3.5 & " " & 3.5 & " " & 0 & " " & Cells(1, j)
    End If
Next
こうなります。
線分で引き出し線を引いて、円を描いて、その中に文字を入れる となっています。
以下 解説です。
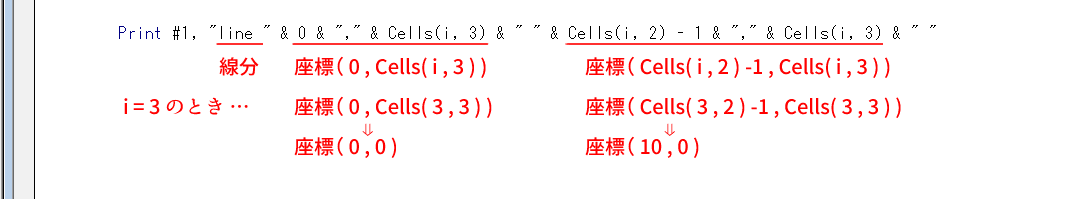
i=3のときは(0,0)と(10,0)を結ぶ線分
i=4のときは((0,-11)と(9,-11)を結ぶ線分
:
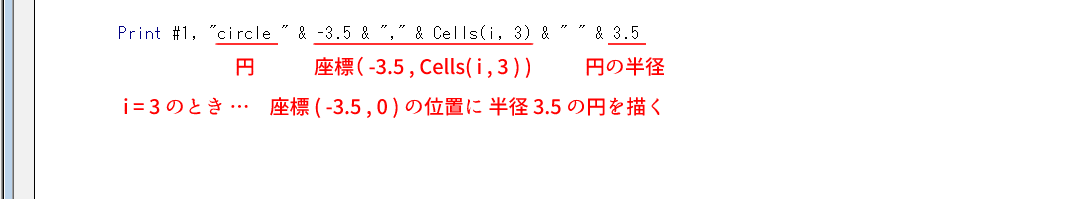
i=3のときは(-3.5,0)の位置に 半径3.5の円
i=4のときは(-3.5,-11)の位置に 半径3.5の円
:
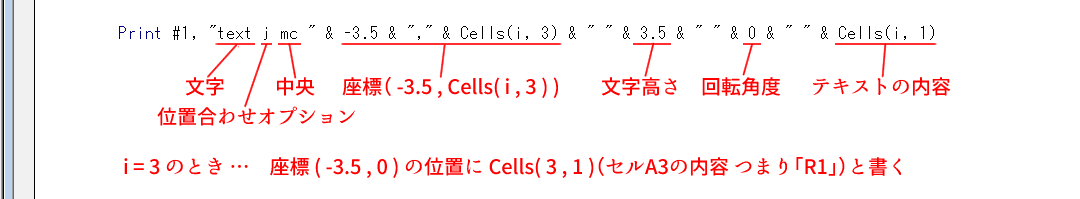
i=3のときは(-3.5,0)の位置に「R1」
i=4のときは(-3.5,-11)の位置に「R2」
:
結果はこうなります。
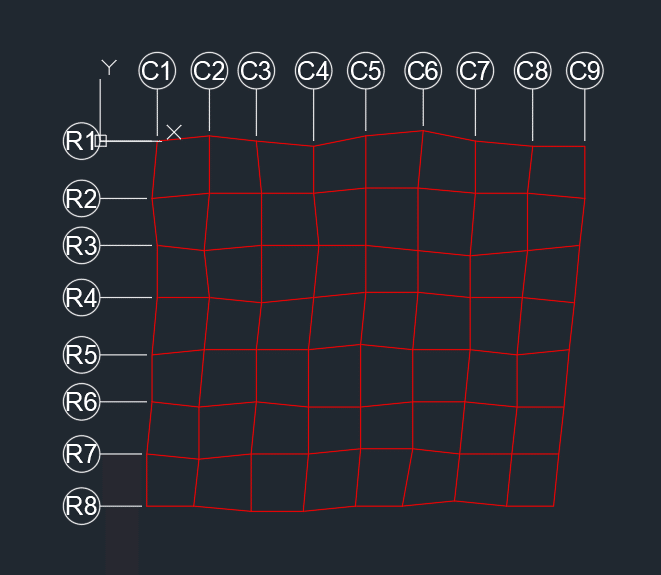
それっぽいのが できましたね。😊
測量データの形式に合わせて プログラムを作っておけば、データに合わせた図面が すぐに描けます。便利ですね。😁
さらに 完成度を上げていきましょう。
・今 描いた平面図に 引き出し線で高さ情報を追記する
・X座標と高さの情報を使って 断面図を描く
まだまだ やれることがあります。
ぜひ 続きも読んでください。
7-2. アドバンス
さあ、どんどん 機能を追加していきましょう。
・引き出し線で高さ情報を追記する
複雑になりそうなので、まずは1列だけ。
コードはこうなります。
ここから先は
¥ 300
「役に立った!」「助かった!」と感じたらサポートいただけると嬉しいです。😊