MATLABによる2つのy軸を持つFigure、2つのx軸を持つFigureの作成方法

1. はじめに
MATLABはMathWorks社が開発する数値解析ソフトウェアおよびプログラミング言語である。これから、MATLABを使用して左側と右側で2つの$${y}$$軸を持つFigureおよび上側と下側で2つの$${x}$$軸を持つFigureの作成方法を説明する。2つの$${y}$$軸を持つFigureを作成する方法としては”yyaxis”を使用する方法が考えられるが、ここでは少し異なる方法でのコードの書き方を示す。
参考 : MATLABによるFigure作成
https://note.com/frances1934/n/naa947cb80314
2. 2つのy軸を持つFigure
図の左側と右側で2つの$${y}$$軸を持つFigureを作成するコード、および出力されたFigureを以下に示す。ここでは$${y_1}$$として余弦関数、$${y_2}$$として2次関数をプロットしている。
%% Data preparation

x = 0:.5:25;
y1 = cos(x/2);
y2 = (x-10).^2;

%% Plot

figure; hold on; box on;
plot(x, y1, 'o-', 'MarkerSize', 9, 'Color', [0 .3 .7], ...
    'MarkerFaceColor', 'none', 'LineWidth', 1.5);
ax(1) = gca;
ax(1).PlotBoxAspectRatio = [2 1 1];
ax(1).LineWidth = 1.2;
ax(1).TickLength = [.015 .015];
ax(1).FontSize = 11;
ax(1).FontName = 'Helvetica';
ax(1).XLim = [0 25];
ax(1).XTick = 0:5:25;
ax(1).XLabel.String = '{\itx}';
ax(1).YLim = [-1 1];
ax(1).YLabel.String = '{\ity}_1';
ax(1).Position=[.2 .2 .6 .4];
ax(1).Box = 'off';
ax(1).YColor = [0 .3 .7];

ax(2) = axes('PlotBoxAspectRatio',get(ax(1),'PlotBoxAspectRatio'), ...
    'LineWidth',get(ax(1),'LineWidth'), ...
    'TickLength',get(ax(1),'TickLength'), ...
    'FontSize',get(ax(1),'FontSize'), ...
    'FontName',get(ax(1),'FontName'), ...
    'XLim',get(ax(1),'XLim'), ...
    'Position', get(ax(1),'Position'));
hold(ax(2), 'on');
plot(ax(2), x, y2,  's-', 'MarkerSize', 9, 'Color', [.85 .45 0], ...
    'MarkerFaceColor', 'none', 'LineWidth', 1.5);
ax(2).Box = 'off';
ax(2).Color = 'none';
ax(2).XAxisLocation = 'top';
ax(2).YAxisLocation = 'right';
ax(2).XTickLabel = {};
ax(2).YLim = [0 280];
ax(2).YLabel.String = '{\ity}_2';
ax(2).YColor = [.85 .45 0];
まず通常通りに$${y_1}$$をプロットし、その座標軸ax(1)のプロパティをドット表記にて設定する。次にaxesにて新たな直交座標軸を作成し、ax(2)として返す。このとき、ax(2)の'PlotBoxAspectRatio', 'Position'等のプロパティをax(1)と一致させることで2つの座標軸を完全に重ねることができる。この状態でax(2)に対して$${y_2}$$をプロットする。ax(2).Color='none'とすることで背面に表示されているax(1)および$${y_1}$$が見えるようになる。各プロットの"Color"とその座標軸の"YColor"を同じ色にすることでデータプロットと$${y}$$軸の対応関係が明瞭になる。
3. 2つのx軸を持つFigure
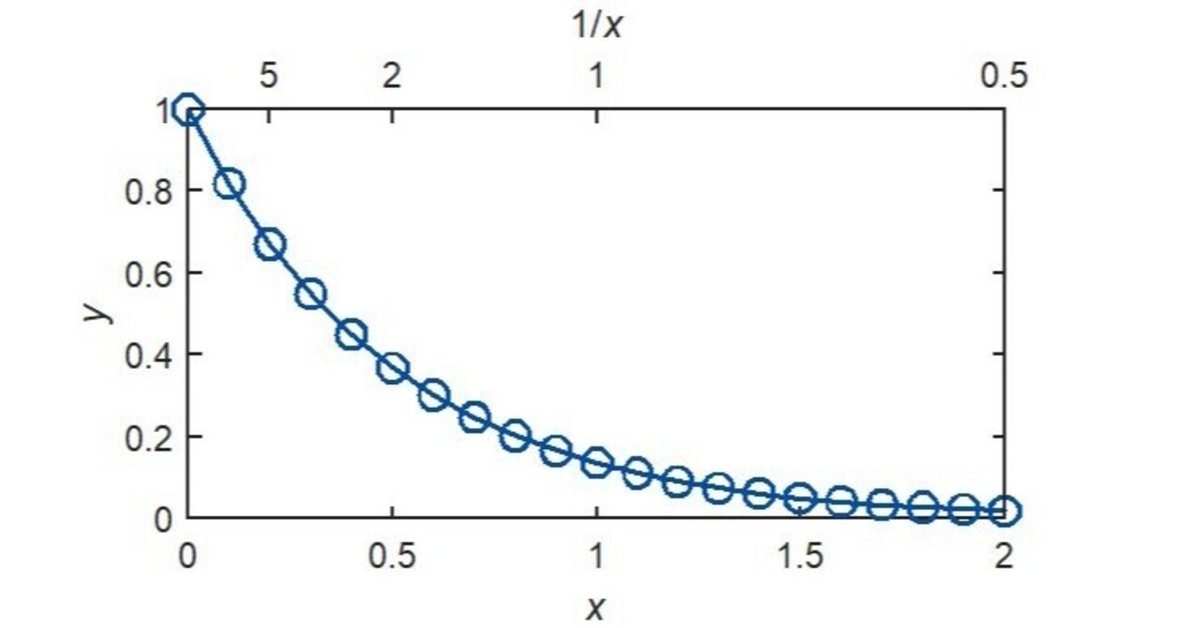
続いて、図の上側と下側で2つの$${x}$$軸を持つFigureを作成するコード、および出力されたFigureを以下に示す。ここでは2つの$${x}$$軸として下側に変数$${x}$$の線形な軸、上側にその逆数$${1/x}$$の軸を表示する。
%% Data preparation

x = 0:.1:2;
y = exp(-x/.5);

%% Plot

figure; hold on; box on;
plot(x, y, 'o-', 'MarkerSize', 9, 'Color', [0 .3 .7], ...
    'MarkerFaceColor', 'none', 'LineWidth', 1.5);
ax(1) = gca;
ax(1).PlotBoxAspectRatio = [2 1 1];
ax(1).LineWidth = 1.2;
ax(1).TickLength = [.015 .015];
ax(1).FontSize = 11;
ax(1).FontName = 'Helvetica';
ax(1).XLim = [0 2];
ax(1).XTick = 0:.5:2;
ax(1).XLabel.String = '{\itx}';
ax(1).YLim = [0 1];
ax(1).YTick = 0:.2:1;
ax(1).YLabel.String = '{\ity}';
ax(1).Position=[.2 .2 .6 .4];
ax(1).Box = 'off';

ax(2) = axes('PlotBoxAspectRatio',get(ax(1),'PlotBoxAspectRatio'), ...
    'LineWidth',get(ax(1),'LineWidth'), ...
    'TickLength',get(ax(1),'TickLength'), ...
    'FontSize',get(ax(1),'FontSize'), ...
    'FontName',get(ax(1),'FontName'), ...
    'XLim',get(ax(1),'XLim'), ...
    'YLim',get(ax(1),'YLim'), ...
    'YTick',get(ax(1),'YTick'), ...
    'Position', get(ax(1),'Position'));
hold(ax(2), 'on');
ax(2).Box = 'off';
ax(2).Color = 'none';
ax(2).XAxisLocation = 'top';
ax(2).YAxisLocation = 'right';
ax(2).YTickLabel = {};
ax(2).XLabel.String = '1/{\itx}';
ax(2).XTick = [.2, .5, 1, 2];
ax(2).XTickLabel = {'5', '2', '1', '0.5'};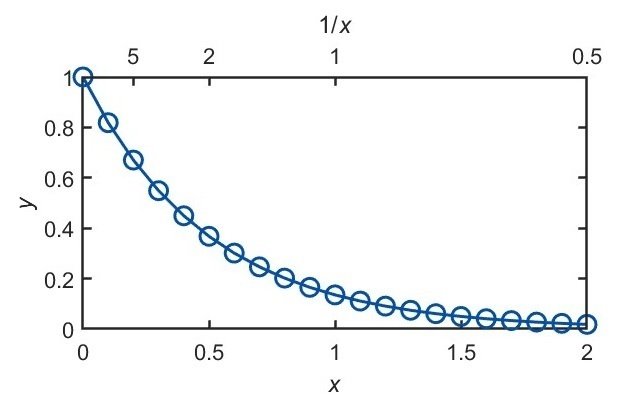
基本的な考え方は2つの$${y}$$軸を持つFigureの作成方法と同様である。まず下側に$${x}$$線形軸を持つ座標軸ax(1)に対して通常通りプロットを行った後、それに重ねる形で新たな座標軸ax(2)を作成する。ax(1)とax(2)のxlimを一致させた状態でax(2)のプロパティを変更し$${1/x}$$軸とする。
4. 参考リンク
axes 直交座標軸の作成
https://jp.mathworks.com/help/matlab/ref/axes.htmlAxes のプロパティ 座標軸の外観と動作
https://jp.mathworks.com/help/matlab/ref/matlab.graphics.axis.axes-properties.html
この記事が気に入ったらサポートをしてみませんか?