南アフリカのSARS-CoV-2感染状況についての分析

※参照などは省略してあります。
元→https://www.medrxiv.org/content/10.1101/2021.10.22.21265316v1.full.pdf
・・・・・・・・・・・・・・・・・・・・・・・・・・・・・・・・・・
The Impact of SARS-CoV-2 Lineages (Variants) on the COVID-19 Epidemic in South Africa
南アフリカでのCOVID-19の流行に対するSARS-CoV-2系統(変異体)の影響
Abstract:
Emerging SARS-CoV-2 variants have been attributed to the occurrence of secondary and tertiary COVID-19 epidemic waves and also threatening vaccine efforts due to their immune invasiveness.
新たなSARS-CoV-2変異体は、二次および三次COVID-19流行波の発生に起因し、免疫侵襲性のためにワクチンの取り組みを脅かしています。
Since the importation of SARS-CoV-2 in South Africa, with the first reported COVID-19 case on the 5th of March 2020, South Africa has observed 3 consecutive COVID-19 epidemic waves.
南アフリカでのSARS-CoV-2の輸入以来、2020年3月5日に最初に報告されたCOVID-19の症例で、南アフリカは3回連続してCOVID-19の流行の波を観測しました。
The evolution of SARS-CoV-2 has played a significant role in the resurgence of COVID-19 epidemic waves in South Africa and across the globe.
SARS-CoV-2の進化は、南アフリカおよび世界中でCOVID-19の流行の波が復活する上で重要な役割を果たしてきました。
South Africa has a unique observation of the evolution of SARS-CoV-2, with distinct SARS-CoV-2 lineages dominating certain epidemic periods.
南アフリカでは、SARS-CoV-2の進化について独自の観察結果があり、特定の流行期間を支配する別個のSARS-CoV-2系統があります。
This unique observation allows for an investigation of the detected SARS-CoV-2 lineages’ impact on COVID-19 transmissibility and severity through analysis of epidemiological data.
この独自の観察により、疫学データの分析を通じて、検出されたSARS-CoV-2系統がCOVID-19の伝染性と重症度に及ぼす影響を調査することができます。
In this study, inferential statistical analysis was conducted on South African COVID-19 epidemiological data to investigate the impact of SARS-CoV-2 lineages in the South African COVID-19 epidemiology.
この調査では、南アフリカのCOVID-19疫学におけるSARS-CoV-2系統の影響を調査するために、南アフリカのCOVID-19疫学データに対して推論統計分析を実施しました。
The general methodology in this study involved the collation of South African COVID-19 epidemiological data, the regression and normalisation of the epidemiological data, and inferential statistical analysis.
この調査の一般的な方法論には、南アフリカのCOVID-19疫学データの照合、疫学データの回帰と正規化、および推論統計分析が含まれていました。
This study shows that the evolution of SARS-CoV-2 resulted in an increase in COVID-19 transmissibility and severity in South Africa.
この研究は、SARS-CoV-2の進化により、南アフリカでCOVID-19の感染率と重症度が増加したことを示しています。
The Delta SARS-CoV-2 VOC resulted in increased COVID-19 transmissibility in the South African population by 53.9 to 54.8 % more than the Beta SARS-CoV-2 VOC and the predominantly B.1.1.54, B.1.1.56 C.1 SA SARS-CoV-2 lineage cluster.
SARS-CoV-2デルタ株により、南アフリカの人口におけるCOVID-19感染率は、SARS-CoV-2 ベータ株や主にB.1.1.54、B.1.1.56 C.1 SASARS-CoV-2系統クラスターよりも53.9〜54.8%増加しました。
The Beta SARS-CoV-2 VOC resulted in more severe COVID-19 in South Africa than the Delta SARS-CoV-2 VOC.
ベータSARS-CoV-2VOCは、南アフリカでデルタSARS-CoV-2VOCよりも深刻なCOVID-19をもたらしました。
While, both the Beta and Delta SARS-CoV-2 VOC resulted in more severe COVID-19 than the initial SARS-CoV-2 lineages detected in South Africa’s first epidemic wave period.
一方、ベータSARS-CoV-2 VOCとデルタSARS-CoV-2VOCはどちらも、南アフリカの最初の流行の波の期間に検出された最初のSARS-CoV-2系統よりも深刻なCOVID-19をもたらしました。
The Delta, Beta SARS-CoV-2 VOCs and the predominantly B.1.1.54, B.1.1.56 C.1 SA SARS-CoV-2 lineage cluster were observed to cause similar COVID-19 hospital case fatality and discharge rates in South African hospitals.
デルタ、ベータSARS-CoV-2 VOC、および主にB.1.1.54、B.1.1.56 C.1 SA SARS-CoV-2系統クラスターは、南アフリカの病院において同様のCOVID-19病院の致死率と退院率を引き起こすことが観察されました。
1. Introduction
On the 11th of March 2020, the World Health Organisation (WHO) declared the Coronavirus Disease 2019 (COVID-19) a global pandemic.
2020年3月11日、世界保健機関(WHO)は、コロナウイルス病2019(COVID-19)を世界的大流行と宣言しました。
The COVID-19 pandemic has resulted in more than 4 809 907 deaths in the reporting period up to the 1st of October 2021.
COVID-19のパンデミックにより、2021年10月1日までの報告期間中に4,809,907人以上が死亡しました。
Public health measures such as nationwide lockdowns aimed at reducing the transmission of COVID-19 have come at a great cost to the world economy.
COVID-19の感染を減らすことを目的とした全国的な封鎖などの公衆衛生対策は、世界経済に多大なコストをかけています。
While, there is global consensus on the health risk posed by COVID-19, ground-breaking vaccine developments, and a great drive towards the vaccination of the world population against COVID-19.
一方、COVID-19によってもたらされる健康リスク、画期的なワクチン開発、およびCOVID-19に対する世界人口のワクチン接種に向けた大きな推進力については世界的なコンセンサスがあります。
There are however challenges that persist in controlling the Global COVID-19 transmission and severity.
ただし、グローバルCOVID-19の感染と重症度の管理には課題が残っています。
One challenge is the large disparity in access to vaccines between the developing and developed worlds.
1つの課題は、発展途上国と先進国の間でワクチンへのアクセスに大きな格差があることです。
Another challenge is the emergent of SARS-CoV-2 lineages and sub-lineages (variants) with increased transmissibility.
もう1つの課題は、伝染性が向上したSARS-CoV-2系統と亜系統(バリアント)の出現です。
Lineages and sub-lineages are a series of entities (in this case genetic) forming a single line of direct ancestry and descent.
系統と亜系統は、直接の祖先と子孫の単一の系統を形成する一連のエンティティ(この場合は遺伝的)です。
Emerging SARS-CoV-2 variants have been attributed to the occurrence of secondary and tertiary COVID-19 epidemic waves and also threatening vaccine efforts due to their immune invasiveness.
新たなSARS-CoV-2変異体は、二次および三次COVID-19の流行波の発生と、免疫侵襲性によるワクチンの取り組みの脅威に起因しています。
SARS-CoV-2 is the virus that causes COVID-19 upon infecting a human host.
SARS-CoV-2は、宿主となるヒトに感染するとCOVID-19を引き起こすウイルスです。
SARS-CoV-2’s early characterisation was reported as a positive pan-Betacoronavirus from bronchoalveolar lavage samples and its whole genome sequence acquired through Illumina and nanopore sequencing.
SARS-CoV-2の初期の特徴は、気管支肺胞洗浄サンプルからの陽性の汎ベータコロナウイルスと、イルミナおよびナノポアシーケンシングによって取得されたその全ゲノム配列として報告されました。
It was identified to have features typical of Coronaviruses belonging to the Betacoronavirus 2B lineage.
ベータコロナウイルス2B系統に属するコロナウイルスに典型的な特徴があることが確認されました。
Betacoronaviruses belong to the subfamily Othrocoronavirinae of the Coronaviridae family, order Nidovirales.
ベータコロナウイルスは、コロナウイルス科の亜科Othrocoronavirinaeに属しており、ニドウイルス目です。
A close relationship was found between SARS-CoV-2 with the BatCoV Rat G13 virus (from the bat (Rhinolophus affinis)) at 96 % identity.
SARS-CoV-2とBatCoVRat G13ウイルス(コウモリ(Rhinolophus affinis)由来)との間に96%の同一性で密接な関係が見られました。
The genetic sequence of SARS-CoV-2 was shared on the 12th of January 2020.
SARS-CoV-2の遺伝子配列は、2020年1月12日に共有されました。
Coronaviruses are positive-stranded Ribonucleic Acid (RNA) viruses.
コロナウイルスは、プラス鎖リボ核酸(RNA)ウイルスです。
The presence of spike glycoproteins in their envelope gives them a crown-like appearance under an electron microscope.
エンベロープにスパイク糖タンパク質が存在すると、電子顕微鏡でクラウンのような外観になります。
The genome of SARS-CoV-2 is a single positive-stranded RNA approximately 29 903 bases (nucleotides) pairs in length.
SARS-CoV-2のゲノムは、長さが約29,903塩基(ヌクレオチド)ペアの単一のプラス鎖RNAです。
There are at least 50 different open reading frames (ORFs) in the SARS-CoV-2 genome which include start codon (AUG) and stop codons (UAG, UAA, UGA).
SARS-CoV-2ゲノムには、開始コドン(AUG)と終止コドン(UAG、UAA、UGA)を含む少なくとも50の異なるオープンリーディングフレーム(ORF)があります。
Origin of transcription sequences allow for SARS-CoV-2 to encode for 50 proteins with structural, nonstructural and accessory functions.
転写配列の起源により、SARS-CoV-2は、構造的、非構造的、および付属機能を備えた50のタンパク質をコードすることができます。
Two-thirds of the SARS-CoV-2 genome encodes for the two main transcription units, ORF1a and ORF1b which are attributed in the encoding of polyproteins, PP1a and PP1ab respectively.
SARS-CoV-2ゲノムの3分の2は、2つの主要な転写ユニットであるORF1aとORF1bをエンコードします。これらは、それぞれポリプロテインPP1aとPP1abのエンコードに起因します。
PP1ab contains ORFs for 16 nonstructural proteins (Nsp1-Nsp16).
PP1abには、16の非構造タンパク質(Nsp1-Nsp16)のORFが含まれています。
Non-structural proteins have functions in replication, proofreading, translation, suppressing host proteins, blocking immune responses, and stabilisation.
非構造タンパク質には、複製、校正、翻訳、宿主タンパク質の抑制、免疫応答の遮断、および安定化の機能があります。
One-third of the SARS-CoV-2 genome encodes the structure and accessory proteins.
SARS-CoV-2ゲノムの3分の1は、構造とアクセサリータンパク質をコードしています。
Accessory genes are positioned along with the structural genes.
アクセサリー遺伝子は構造遺伝子と一緒に配置されます。
There are at least nine ORFs for accessory proteins in the SARS-CoV-2 genome.
SARS-CoV-2ゲノムには、アクセサリータンパク質用のORFが少なくとも9つあります。
Accessory proteins do not play a significant role in viral replication but play a role in the interaction between the viral genome and the host particularly blocking the production of cytokines.
アクセサリータンパク質は、ウイルス複製では重要な役割を果たしませんが、ウイルスゲノムと宿主の間の相互作用、特にサイトカインの産生をブロックする役割を果たします。
With regards to structure, there are four main structural proteins in SARS-CoV-2.
構造に関しては、SARS-CoV-2には4つの主要な構造タンパク質があります。
These are the Spike (S), Membrane (M), Envelope (E), and the Nucleocapsid (N) proteins.
これらは、スパイク(S)、メンブレン(M)、エンベロープ(E)、およびヌクレオカプシド(N)タンパク質です。
The Nucleocapsid proteins coat the SARS-COV-2 RNA for genetic protection.
Nucleocapsidタンパク質は、遺伝的保護のためにSARS-COV-2RNAをコーティングします。
During infection, the Spike glycoprotein undergoes cleavage (unique furin-like cleavage site (FCS)) into amino (N) terminal S1 and carboxyl (C)-terminal S2 subunits.
感染中、スパイク糖タンパク質は、アミノ(N)末端S1およびカルボキシル(C)末端S2サブユニットへの切断(固有のフューリン様切断部位(FCS))を受けます。
The SI subunit facilitates the incorporation of SAR-CoV-2 into the host cell while the S2 subunit is responsible for membrane fusion.
SIサブユニットはSAR-CoV-2の宿主細胞への取り込みを促進し、S2サブユニットは膜融合を担います。
The S1 subunit has a receptor binding (RBD) and N-terminal (NTD) domain.
S1サブユニットには、受容体結合(RBD)ドメインとN末端(NTD)ドメインがあります。
SARS-CoV-2 binds to the human angiotensin-converting enzyme 2 (ACE2) receptors which are abundant in the respiratory epithelium but are also expressed by other cells such as the upper oesophagus, enterocytes (ileum), myocardial cells, proximal tubular cells (kidney), and urothelial cells (bladder).
SARS-CoV-2は、呼吸上皮に豊富に存在するが他の細胞(上部食道、腸細胞(回腸)、心筋細胞、近位尿細管細胞(腎臓)、尿路上皮細胞(膀胱)など)によっても発現されるヒトアンジオテンシン変換酵素2(ACE2)受容体に結合します。
The binding is achieved through the SARS-CoV-2 Spike Protein (S1).
結合はSARS-CoV-2スパイクタンパク質(S1)を介して達成されます。
Once the attachment has been achieved priming of the SARS-CoV-2 Spike Protein (S2) by the host transmembrane serine protease 2 (TMPRSS2) allows for viral cell entry and replication endocytosis.
付着が達成されると、宿主の膜貫通セリンプロテアーゼ2(TMPRSS2)によるSARS-CoV-2スパイクタンパク質(S2)のプライミングにより、ウイルス細胞の侵入と複製エンドサイトーシスが可能になります。
One of the first reported SARS-CoV-2 genomes was the Wuhan-Hu-1 (MN908947.3) (sampled on the 26th of December 2019) and the Wuhan/WH04/2020 strains.
最初に報告されたSARS-CoV-2ゲノムの1つは、武漢-Hu-1(MN908947.3)(2019年12月26日にサンプリング)と武漢/ WH04 / 2020株でした。
In July 2020, a dynamic nomenclature for SARS-CoV-2 lineage assignment was designed by Rambaut et al, 2020 and an algorithm to outline links in viral genomes developed known as the Phylogenetic Assignment of Named Global Outbreak LINeages (PANGOLIN).
2020年7月、SARS-CoV-2系統割り当ての動的な命名法が、Rambauら(2020)によって設計され、ウイルスゲノムのリンクの概要を示すアルゴリズムが開発されました。Named Global Outbreak LINeages(PANGOLIN)の系統発生的割り当てとして知られています。
Based on this classification, 2 major lineages can be identified in the main phylogeny of SARS-CoV-2, lineages A and B.
この分類に基づいて、SARS-CoV-2の主要な系統発生である系統AとBの2つの主要な系統を特定できます。
Lineage A can be defined based on the Wuhan/WH04/2020 genome sharing 2 nucleotides (positions 8 782 in ORF1ab and 28 144 in ORF8) while lineage B has different nucleotides present at those sites such as the Wuhan-Hu-1 genome.
系統Aは、2つのヌクレオチドを共有するWuhan / WH04 / 2020ゲノム(ORF1abの位置8 782およびORF8の位置28144)に基づいて定義できますが、系統Bには、Wuhan-Hu-1ゲノムなどのサイトに異なるヌクレオチドが存在します。
By the 20th of December 2020, there were 261 487 whole or partial genome sequences publicly available, shared through the Global Initiative on Sharing Avian Influenza Data (GISAID).
2020年12月20日までに、鳥インフルエンザ情報共有の世界イニシアチブ(GISAID)を通じて共有された、261,487の全ゲノムまたは部分ゲノムシーケンスが公開されました。
From this genomic data, sub-lineages of lineages A and B were identified.
このゲノムデータから、系統AおよびBの亜系統が特定されました。
Two main lineages were also identified, lineage C and D, and these were reassigned to the classification of lineage B.
2つの主要な系統、系統CとDも特定され、これらは系統Bの分類に再割り当てされました。
More than 266 lineages/sub-lineages were identified globally.
世界中で266を超える系統/サブ系統が特定されました。
In the year 2020, lineage B and sub-lineage B.1 were the most reported in genetic samples worldwide.
2020年には、系統Bと亜系統B.1が、世界中の遺伝子サンプルで最も多く報告されました。
Whole-genome sequencing of 104 strains of SAR-CoV-2 from patients with COVID-19 symptom onsets in the period of December 2019 to Mid-February 2020 showed 99.9 % homology, without significant mutations.
2019年12月から2020年2月中旬にCOVID-19症状が発症した患者からの、104株のSAR-CoV-2の全ゲノムシーケンスでは、99.9%の相同性が示され、有意な変異はありませんでした。
However, the rapid spread of SARS-CoV-2 has allowed the virus opportune replications to evolve into different lineages and sub-lineages.
ただし、SARS-CoV-2の急速な普及により、ウイルスの適切な複製がさまざまな系統や亜系統に進化することが可能になりました。
RNA viruses are prone to genetic evolution with resultant genomes that have different characteristics than the ancestral strain.
RNAウイルスは遺伝的に進化する傾向があり、結果として生じるゲノムは祖先の株とは異なる特性を持っています。
Coronaviruses including SARS-CoV-2 can proofread during replication however this has not limited the mutation of the SARS-CoV-2 genome in forming new lineages and sub-lineages.
SARS-CoV-2を含むコロナウイルスは、複製中に校正することができますが、これは、新しい系統および亜系統の形成におけるSARS-CoV-2ゲノムの変異を制限するものではありません。
To prioritise global monitoring and research and to inform the ongoing response to the COVID-19 pandemic, SARS-CoV-2 variants have been characterised as either ‘Variants of Concern’ (VOCs)’ or ‘Variants of Interest’ (VOIs)’.
グローバルな監視と調査に優先順位を付け、COVID-19パンデミックへの継続的な対応を通知するために、SARS-CoV-2バリアントは、「懸念のバリアント」(VOC)または「関心のあるバリアント」(VOI)のいずれかとして特徴付けられています。
The main characteristics of VOCs are that they have evidence of an increase in transmissibility, more severe disease that leads to increased hospitalisation or deaths, therefore reducing the effectiveness of public health and social measures.
VOCの主な特徴は、伝染性の増加、入院または死亡の増加につながるより重篤な疾患の証拠があるため、公衆衛生および社会的措置の有効性が低下することです。
Additionally, VOCs significantly reduce the neutralisation of antibodies generated during previous infection or vaccination which ultimately reduces the effectiveness of treatments or vaccines, or diagnostic detection.
さらに、VOCは、以前の感染またはワクチン接種中に生成された抗体の中和を大幅に低減し、最終的には治療やワクチン、または診断検出の有効性を低下させます。
Variants of Interest (VOIs) are variants whose changes have predicted genetic markers that are known to affect virus characteristics such as transmissibility, disease severity, immune escape, diagnostic or therapeutic escape.
関心のある変異株(VOI)は、その変化により、伝染性、病気の重症度、免疫回避、診断または治療の回避などのウイルス特性に影響を与えることが知られている遺伝子マーカーが予測された変異株です。
They are also identified to have a predictable increase in transmissibility or disease severity thus having an apparent epidemiological impact to suggest an emerging risk to global public health.
また、伝染性や病気の重症度が予測可能に増加することが確認されているため、世界の公衆衛生に対する新たなリスクを示唆する明らかな疫学的影響があります。
The SARS-CoV-2 variants that have been characterised as VOCs by WHO are the Alpha (B.1.1.7), Beta (B.1.351, B1.351.2, B.1.351.3), Gamma (P.1, P.1.1, P.1.2, P.1.4, P1.6, P.1.7), and Delta (B.1.617.2, AY.1, AY.2, AY.3, AY.3.1) SARS-CoV-2 lineages (WHO, 2021; CDC, 2021).
WHOによってVOCとして特徴付けられているSARS-CoV-2バリアントは、アルファ株(B.1.1.7)・ベータ株(B.1.351、B1.351.2、B.1.351.3)・ガンマ株(P.1、P.1.1、P.1.2、P.1.4、P1.6、P .1.7)、およびデルタ株(B.1.617.2、AY.1、AY.2、AY.3、AY.3.1)のSARS-CoV-2系統です(WHO、2021、CDC、2021)。
While, the variants that have been characterised as VOIs are the Eta (B.1.525), Iota (B.1.526), Kappa (B.1.617.1), and Lambda (C.37) SARS-CoV-2 lineages.
一方、VOIとして特徴付けられているバリアントは、Eta(B.1.525)、Iota(B.1.526)、Kappa(B.1.617.1)、およびLambda(C.37)SARS-CoV-2系統です。
※2021年10月27日現在、VOIは、ラムダ株とミュー株(B.1.621)の2つです。他は取り下げられています。
The Alpha SARS-CoV-2 VOC (B.1.1.7 lineage) (formerly GR/501Y.V1) was reported in December 2020 based on United Kingdom whole-genome sequence samples from patients with positive laboratory tests of SARS-CoV-2.
SARS-CoV-2 アルファ株(B.1.1.7系統)(以前のGR / 501Y.V1)は、SARS-CoV-2の臨床検査で陽性の患者からの英国の全ゲノム配列サンプルに基づいて、2020年12月に報告されました。
This lineage was also detected in commercial assays due to the absence of the S gene in PCR samples.
この系統は、PCRサンプルにS遺伝子が存在しないため、市販のアッセイでも検出されました。
The B.1.1.7 lineage had 17 mutations in its genome.
B.1.1.7系統には、そのゲノムに17の変異がありました。
Eight of these mutations were in the Spike protein at Δ69-70 deletion, Δ144 deletion, N501Y, A570D, P681H, T716I, S982A, and D1118H.
これらの変異のうち8つは、スパイクたんぱく質にありました。Δ69-70の欠失、Δ144の欠失、N501Y、A570D、P681H、T716I、S982A、およびD1118Hです。
The mutation at N501Y showed increased affinity by the Spike protein in SARS-CoV-2 to the ACE 2 receptors.
N501Yでの変異は、SARS-CoV-2のスパイクタンパク質によるACE2受容体への親和性の増加を示しました。
The B.1.1.7 lineage was reported to be 43 % to 82 % more transmissible and became the dominant SAR-CoV-2 lineage in the UK.
B.1.1.7系統は、伝染性が43%から82%高いと報告されており、英国で主要なSAR-CoV-2系統になりました。
The Gamma SARS-CoV-2 variant (P.1, P.1.1, P.1.2, P.1.4, P1.6, P.1.7 lineages) (formerly GR/501Y.V3.) was identified in December 2020 in Brazil and the United States(US) in January 2021.
ガンマSARS-CoV-2バリアント(P.1、P.1.1、P.1.2、P.1.4、P1.6、P.1.7系統)(以前のGR / 501Y.V3)は、2020年12月にブラジルと米国(US)で2021年1月に特定されました。
The P.1 lineage had 10 mutations in the Spike protein at 18F, T20N, P26S, D138Y, R190S, H655Y, T1027I V1176, K417T, E484K, and N501Y.
P.1系統では、18F、T20N、P26S、D138Y、R190S、H655Y、T1027I V1176、K417T、E484K、およびN501Yのスパイクタンパク質に10個の変異がありました。
Three of those mutations (L18F, K417N, E484K) were located in the RBD.
それらの突然変異のうちの3つ(L18F、K417N、E484K)はRBDに位置していました。
The Gamma SARSCoV-2 variant showed reduced neutralization by monoclonal antibody therapies, post-vaccination, and convalescent sera.
ガンマSARSCoV-2変異体は、モノクローナル抗体療法、ワクチン接種後、回復期の血清による中和の低下を示しました。
The Delta (B.1.617.2, AY.1, AY.2, AY.3, AY.3.1 lineage) and the Kappa (B.1.617.1 lineage) SARS-CoV-2 variants were first identified in December 2020 in India.
デルタ(B.1.617.2、AY.1、AY.2、AY.3、AY.3.1系統)およびカッパ(B.1.617.1系統)のSARS-CoV-2バリアントは、2020年12月にインドで最初に特定されました。
The Delta SARS-CoV-2 variant was initially considered a VOI by the WHO but was subsequently classed as a VOC during the deadly second COVID-19 epidemic wave in India in April 2021.
SARS-CoV-2 デルタ株は、当初WHOによってVOIと見なされていましたが、その後、2021年4月にインドで発生した致命的な2回目のCOVID-19流行の波の間にVOCとして分類されました。
The Delta SARS-CoV-2 VOC had 10 mutations in the Spike protein at T19R, (G142D*), 156del, 157del, R158G, L452R, T478K, D614G, P681R, and D950N.
SARS-CoV-2 デルタ株には、T19R(G142D *)、156del、157del、R158G、L452R、T478K、D614G、P681R、D950Nのスパイクタンパク質に10個の変異がありました。
While the Kappa SARS-CoV-2 VOI had Spike protein mutations of interest at T95I, G142D, E154K, L452R, E484Q, D614G, P681R, and Q1071H.
カッパSARS-CoV-2VOIには、T95I、G142D、E154K、L452R、E484Q、D614G、P681R、およびQ1071Hで対象のスパイクタンパク質変異がありました。
The Delta SARS-CoV-2 variant was also detected in March 2021 in the US and became the dominant SARS-CoV-2 lineage in the US.
SARS-CoV-2 デルタ株は、2021年3月に米国でも検出され、米国で優勢なSARS-CoV-2系統になりました。
Prior, the Eta (B.1.525 lineage), and Iota (B.1.526 lineage) SARS-CoV-2 VOIs were detected in the US in November 2020.
それより前に、2020年11月に米国でEta(B.1.525系統)およびIota(B.1.526系統)SARS-CoV-2VOIが検出されました。
They had Spike protein mutations of interest at B.1.525: A67V, Δ69/70, Δ144, E484K, D614G, Q677H, F888L and B.1.526: L5F*, T95I, D253G, S477N*, E484K*, D614G, A701V* respectively.
B.1.525で対象のスパイクタンパク質変異がありました:A67V、Δ69/ 70、Δ144、E484K、D614G、Q677H、F888L、B.1.526:それぞれL5F *、T95I、D253G、S477N *、E484K *、D614G、A701V *。
While in South America, the Lambda (C.37 lineage) SARS-CoV-2 variant was detected in Peru and classed as a VOI due to its increased presence in SARSCoV-2 genetic samples from the region.
一方、南アメリカでは、ラムダ(C.37系統)のSARS-CoV-2変異体がペルーで検出され、この地域のSARSCoV-2遺伝子サンプルでの存在が増加したため、VOIとして分類されました。
Of interest in this study is the impact of the SARS-CoV lineages and sub-lineages in the COVID-19 epidemic waves in South Africa.
この研究で注目するのは、南アフリカのCOVID-19流行波におけるSARS-CoV系統と亜系統の影響です。
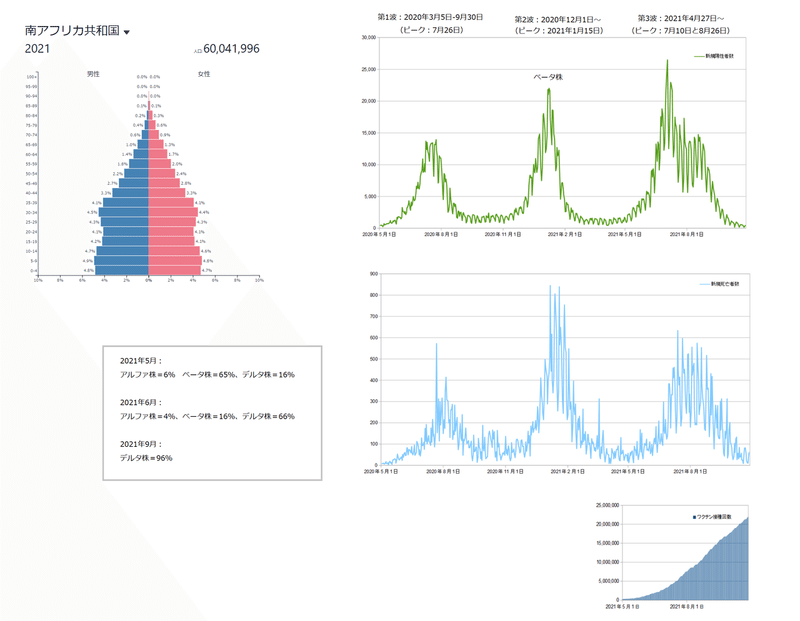
Since the importation of SARS-CoV-2 in South Africa, with the first reported COVID-19 case on the 5th of March 2020, South Africa has observed 3 consecutive COVID-19 epidemic waves.
南アフリカでのSARS-CoV-2の輸入以来、2020年3月5日に最初に報告されたCOVID-19の症例で、南アフリカは3回連続してCOVID-19の流行の波を観測しました。
The first COVID-19 epidemic wave in South Africa was observed between the reporting periods of 5 March to 30 September 2020 with a peak of 173 587 Active COVID-19 cases and a peak date of 26 July 2020.
南アフリカでの最初のCOVID-19流行の波は、2020年3月5日から9月30日までの報告期間中に観察され、ピークは173 587のアクティブCOVID-19症例で、ピーク日は2020年7月26日でした。
The second COVID-19 epidemic wave in South Africa resurged on the 1st of December 2020 with 212 529 peak Active COVID-19 cases and a peak date of 15 January 2021.
南アフリカでの2回目のCOVID-19流行の波は、2020年12月1日に復活し、アクティブなCOVID-19のピークは212 529で、ピーク日は2021年1月15日でした。
On the 27th of April 2021, the third COVID-19 epidemic wave in South Africa resurged.
2021年4月27日、南アフリカで3番目のCOVID-19流行の波が復活しました。
The third COVID-19 epidemic wave in South Africa had two observed peaks on the 10th of July and on the 26th of August 2021 with 211 052 and 169 039 Active COVID-19 cases respectively lasting up to the end of September 2021.
南アフリカでの3回目のCOVID-19流行波では、2021年7月10日と8月26日に2つのピークが観測され、それぞれ211052と169039のアクティブなCOVID-19症例が2021年9月末まで続きました。
The response by the Government of South Africa to the COVID-19 epidemic was the establishment of a National Coronavirus Command Council to oversee the epidemic, the use of health policy measures including NPIs to try to mitigate the transmission of COVID-19 and the implementation of COVID-19 vaccination programmes to try to vaccinate the South African population against COVID-19.
COVID-19の流行に対する南アフリカ政府の対応は、流行を監督するための全国コロナウイルス司令部の設立・COVID-19の感染を軽減するためのNPIを含む健康政策措置の使用・COVID-19に対する南アフリカの住民へのワクチン接種を試みるためのCOVID-19ワクチン接種プログラムの実施でした。
As of 19 September 2021, 15.8 million people have been vaccinated against COVID-19 in South Africa mainly with the Pfizer-BioNTech (Comirnaty) and the Johnson & Johnson/Janssen COVID-19 vaccines.
2021年9月19日の時点で、南アフリカでは、主にPfizer-BioNTech(Comirnaty)とJohnson&Johnson / JanssenCOVID-19ワクチンで1580万人がCOVID-19の予防接種を受けています。
“Globally, systems have been established and are being strengthened to detect ‘signals’ of potential VOIs or VOCs and assess these based on the risk posed to global public health”.
「世界的に、潜在的なVOIまたはVOCの「信号」を検出し、世界の公衆衛生にもたらされるリスクに基づいてこれらを評価するためのシステムが確立され、強化されています。」
In South Africa, the Network for Genomics Surveillance in South Africa (NGS-SA) was formed to understand the spread of SARS-CoV-2.
南アフリカでは、SARS-CoV-2の蔓延を理解するために、南アフリカのゲノミクス監視ネットワーク(NGS-SA)が設立されました。
The NGS-SA was launched in June 2020 and this consortium comprised of the National Health Laboratory Services (NHLS) and associated academic institutions, the National Institute for Communicable Diseases (NICD), KZN Research Innovation & Sequencing Platform (KRISP), Stellenbosch University (SU), University of Cape Town (UCT), University of Free State (UFS), University of Pretoria (UP), University of KwaZulu-Natal (UKZN), and the South African National Bioinformatics Institute (SANBI).
NGS-SAは2020年6月に開始され、このコンソーシアムはNational Health Laboratory Services(NHLS)と関連する学術機関である国立伝染病研究所(NICD)・KZN Research Innovation&Sequencing Platform(KRISP)・ステレンボッシュ大学(SU)・ケープタウン大学(UCT)・自由州立大学(UFS)・プレトリア大学(UP)・クワズールナタール大学(UKZN)・南アフリカ国立バイオインフォマティクス研究所(SANBI)で構成されています。
In the first COVID-19 epidemic wave in South Africa, 16 SARS-CoV-2 lineages specific to South Africa were identified from 1 365 high-quality whole genomes.
南アフリカでの最初のCOVID-19流行の波では、南アフリカに固有の16のSARS-CoV-2系統が、1365の高品質な全ゲノムから特定されました。
From these 16 lineages, three main clusters (B.1.1.54, B.1.1.56, and C.1 SARS-CoV-2 lineages) were identified to have caused approximately 42% of the SARS-CoV-2 infections in South Africa.
これらの16の系統から、南アフリカでSARS-CoV-2感染の約42%を引き起こした3つの主要なクラスター(B.1.1.54、B.1.1.56、およびC.1 SARS-CoV-2系統)が特定されました。
Another sub lineage specific to South Africa was the B.1.106 lineage that emerged in the Kwa-Zulu Natal province in a nosocomial outbreak during the first COVID-19 epidemic wave.
南アフリカに固有のもう1つの亜系統は、最初のCOVID-19流行の波の間に院内感染が発生したときに、クワズールナタール州で出現したB.1.106系統でした。
The prevalence of this sub-lineage decreased as a result of control measures.
この亜系統の有病率は、管理措置の結果として減少しました。
The C.I lineage (first identified C lineage of SARS-CoV-2) was the most geographically spread lineage in South Africa’s first COVID-19 epidemic wave.
C.I系統(SARS-CoV-2の最初に特定されたC系統)は、南アフリカで最初のCOVID-19流行の波の中で最も地理的に広がった系統でした。
Before the resurgence of the second COVID-19 epidemic wave in South Africa, the Beta (B.1.351, B1.351.2, B.1.351.3 lineages) SARS-CoV-2 VOC (formerly GR/501Y.V2) was identified in an analysis of 2 704 South African SARS-CoV-2 genotypes (samples up to 14th of December 2020) from the GISAID database.
南アフリカで2回目のCOVID-19流行の波が復活する前に、GISAIDデータベースからの2704の南アフリカSARS-CoV-2遺伝子型の分析(2020年12月14日までのサンプル)でベータSARS-CoV-2VOC(B.1.351、B1.351.2、B.1.351.3系統)が特定されました。
The Beta (B.1.351 lineage) SARSCoV-2 VOC(以前のGR / 501Y.V2) was detected in samples collected in the months of October 2020.
ベータ(B.1.351系統)SARSCoV-2 VOC(序のGR / 501Y.V2)は、2020年10月に収集されたサンプルで検出されました。
The Beta (B.1.351 lineage) SARS-CoV-2 VOC had 9 mutations in the Spike protein at L18F, D80A, D215G, R246I, K417N, E484K, N501Y, D614G, and A701V.
ベータ(B.1.351系統)SARS-CoV-2 VOCには、L18F、D80A、D215G、R246I、K417N、E484K、N501Y、D614G、およびA701Vのスパイクタンパク質に9つの変異がありました。
Three of those mutations (K417N, E484K, N501Y)) were located in the RBD.
それらの突然変異のうちの3つ(K417N、E484K、N501Y))はRBDに位置していました。
The Beta SARS-CoV-2 lineage became the dominant lineage in South Africa’s second COVID-19 epidemic wave rapidly replacing the three main clusters (B.1.1.54, B.1.1.56 and C.1 SARS-CoV-2 lineages) identified during the first COVID-19 epidemic wave.
ベータSARS-CoV-2系統は、南アフリカの2番目のCOVID-19流行波で支配的な系統となり、最初のCOVID-19流行波で特定された3つの主要なクラスター(B.1.1.54、B.1.1.56およびC.1 SARS-CoV-2系統)に急速に取って代わりました。
A study by [53] showed that the Beta SARS-CoV-2 lineage required a halfmaximal inhibitory concentration (IC50) 6 to 200 fold higher than the lineages identified in the first wave.
[53]による研究では、ベータSARS-CoV-2系統には、最初の波で特定された系統よりも6〜200倍高い最小発育阻止濃度(IC50)が必要であることが示されました。
Indicating that the Beta SARS-CoV-2 variant may escape neutralising antibody response developed from prior infections.
ベータSARS-CoV-2変異体が、以前の感染から発生した中和抗体反応を回避する可能性があることを示します。
In the resurgence of the third COVID-19 epidemic wave in South Africa, four SARS-CoV variants were identified which were the Alpha, Beta, Eta, and Delta SARS-CoV variants.
南アフリカでの3回目のCOVID-19流行の復活では、アルファ、ベータ、イータ、デルタのSARS-CoVバリアントの4つのSARS-CoVバリアントが特定されました。
Genomic data for South African samples, identified 65 % of 1147 whole genomes from May 2021 to be the Beta SARS-CoV-2 variant.
南アフリカのサンプルのゲノムデータでは、2021年5月の1147個の全ゲノムの65%がベータSARS-CoV-2バリアントであることが確認されました。
The Alpha, Delta, and Eta SARS-CoV-2 variants accounted for 6 %, 16 %, and 1 % of those samples respectively.
これらのサンプルではアルファ株=6%、デルタ株=16%、およびイータ株=1%を占めました。
In June 2021, with 2931 genetic sequences in that period, the Delta SARS-CoV-2 variant had become the dominant variant in samples collected in South Africa at 66 % while the Beta and Alpha SARS-CoV-2 variants accounted for 16 % and 4 % respectively.
2021年6月、その期間に2931の遺伝子配列では、南アフリカで収集されたサンプルにおいて、デルタ株が66%で優勢なバリアントになりましたが、ベータ株=16%およびアルファ株=4%を占めていました。
By the end of South Africa’s third COVID-19 epidemic wave in September 2021, the Delta SARS-CoV-2 variant accounted for 96 % of the 186 whole-genome sampled in that period while the C1.2 SARS-CoV-2 lineage account for 1 % of those samples.
2021年9月の南アフリカの3回目のCOVID-19流行の波の終わりまでに、その期間にサンプリングされた186の全ゲノムの96%をデルタ株が占め、C1.2 SARS-CoV-2系統はそれらのサンプルの1%を占めました。
The C1.2 SARS-CoV-2 lineage was a new South Africa specific SARS-CoV-2 lineage identified in South African samples in the month of May 2021 and evolved from the C.1 SARS-CoV-2 lineage.
C1.2 SARS-CoV-2系統は、2021年5月に南アフリカのサンプルで特定された新しい南アフリカ固有のSARS-CoV-2系統であり、C.1SARS-CoV-2系統から発展したものです。
The C.1.2 SARS-CoV-2 lineage had several mutations with multiple substitutions (R190S, D215G, N484K, N501Y, H655Y and T859N) and deletions (Y144del, L242-A243del) in the Spike protein.
C.1.2 SARS-CoV-2系統には、スパイクタンパク質に複数の置換(R190S、D215G、N484K、N501Y、H655Y、T859N)と欠失(Y144del、L242-A243del)を伴ういくつかの変異がありました。
There was also an accumulation of additional mutation (C136F, Y449H and N679K) in the C.1.2 SARS-CoV-2 thought to likely impact neutralisation sensitivity.
また、中和感度に影響を与える可能性が高いと考えられるC.1.2 SARS-CoV-2には、追加の突然変異(C136F、Y449H、およびN679K)の蓄積がありました。
The C.1.2 has been detected across the majority of South African provinces and in seven other countries.
C.1.2は、南アフリカの大多数の州と他の7か国で検出されています。
The evolution of SARS-CoV-2 has played a significant role in the resurgence of COVID-19 epidemic waves in South Africa and across the globe.
SARS-CoV-2の進化は、南アフリカおよび世界中でCOVID-19の流行の波が復活する上で重要な役割を果たしてきました。
South Africa has a unique observation of the evolution of SARS-CoV-2, with distinct SARS-CoV-2 lineages dominating certain epidemic periods.
南アフリカでは、SARS-CoV-2の進化について独自の観察結果があり、特定の流行期間を支配しているのは異なるSARS-CoV-2系統です。
This unique observation allows for an investigation of the detected SARS-CoV-2 lineages’ impact on COVID-19 transmissibility and severity through analysis of epidemiological data.
この独自の観察により、疫学データの分析を通じて、検出されたSARS-CoV-2系統がCOVID-19の伝染性と重症度に与える影響を調査することができます。
In this study, inferential statistical analysis was conducted on South African COVID-19 epidemiological data to investigate the impact of SARS-CoV-2 lineages in the South African COVID-19 epidemiology.
この研究では、南アフリカのCOVID-19疫学におけるSARS-CoV-2系統の影響を調査するために、南アフリカのCOVID-19疫学データに対して推論統計分析を実施しました。
2. Methodology
省略します。
3. Results and Discussions
3.1 Impact of SARS-CoV-2 Lineages on the COVID-19 Transmissibility in South Africa
3.1南アフリカにおけるCOVID-19感染率に対するSARS-CoV-2系統の影響
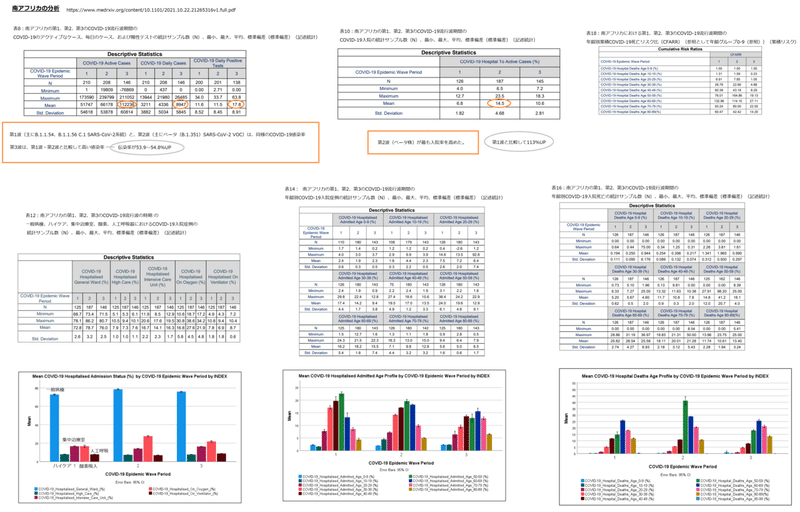
Table 8 shows the descriptive statistics for the COVID-19 active, daily cases and daily positive tests for the first, second and third COVID-19 epidemic wave periods in South Africa.
表8は、南アフリカでのCOVID-19の活動的な毎日の症例と、1回目、2回目、3回目のCOVID-19流行波期間の毎日の陽性テストの記述統計を示しています。
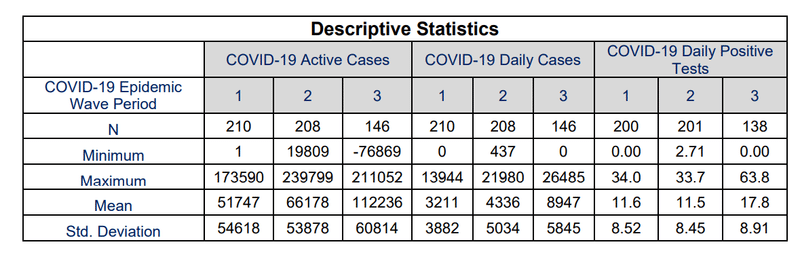
Table 8 shows that the mean COVID-19 daily active cases in South Africa’s first, second and third COVID-19 epidemic wave period were 51 747±54 618, 66 178±53 878 and 112 236±60 814 respectively.
表8は、南アフリカの第1、第2、第3のCOVID-19流行波期間におけるCOVID-19の1日の平均活動例が、それぞれ51747±54618、66178±53878、112236±60814であることを示しています。
The maximum COVID-19 daily active cases were 173 590, 239 799 and 211 052 respectively while the COVID-19 daily cases were 3 211±3 882, 4 336±5 034 and 8 947±5 845 respectively.
COVID-19の1日あたりの最大活動症例数はそれぞれ173590、239 799、211052でしたが、COVID-19の1日あたりの症例数はそれぞれ3 211±3882、4336±5034、8947±5845でした。
The mean COVID-19 active cases and daily cases in the third COVID-19 epidemic period in South Africa were observed to be higher than those of the first and second COVID-19 epidemic wave period.
南アフリカでの第3COVID-19流行期間の平均COVID-19活動症例と毎日の症例は、第1および第2COVID-19流行波期間の症例よりも高いことが観察されました。
The COVID-19 daily positive tests indicate the transmissibility of COVID-19 based on the detection rate of COVID-19 and account for covariance in the testing rate for statistical comparison between epidemic wave periods.
COVID-19の毎日の陽性テストは、COVID-19の検出率に基づいて、COVID-19の感染率を示し、流行の波の期間間の統計的比較のためにテスト率の共分散を説明します。
The mean COVID-19 daily positive tests in South Africa’s first, second and third COVID-19 epidemic wave period were 11.6 ±8.52 %, 11.5±8.45 % and 17.8±8.91 % respectively.
南アフリカの第1、第2、第3のCOVID-19流行波期間におけるCOVID-19の毎日の平均陽性テストは、それぞれ11.6±8.52%、11.5±8.45%、17.8±8.91%でした。
The mean COVID-19 daily positive tests in South Africa’s first and second COVID-19 epidemic wave had a difference of 0.86 %.
南アフリカの最初と2番目のCOVID-19流行波におけるCOVID-19の毎日の平均陽性テストでは、0.86%の差がありました。
This difference was relatively small compared to the difference between the mean COVID-19 daily active and cases in the same periods.
この差は、COVID-19の1日の平均活動量と、同じ期間の症例の差と比較して比較的小さかった。
The relative difference of the mean COVID-19 daily positive tests, active and cases shows the need to account for the covariance of COVID-19 testing in COVID-19 daily active and cases to improve the accuracy of the respective parameters.
COVID-19の毎日の陽性テスト、アクティブ、ケースの平均の相対的な違いは、それぞれのパラメータの精度を向上させるために、COVID-19の毎日のアクティブテストとケースのCOVID-19テストの共分散を考慮する必要があることを示しています。
The relatively small difference between the mean COVID-19 daily positive tests in South Africa’s first and second COVID-19 epidemic wave suggests that the SARS-CoV-2 lineage cluster 1 (predominantly B.1.1.54, B.1.1.56 C.1 SARS-CoV-2 lineages) detected in the first COVID-19 epidemic wave period resulted in similar COVID-19 transmissibility in the South Africa population when compared with the SARS-CoV-2 lineage cluster 2 (predominantly Beta (B.1.351) SARS-CoV-2 VOC) detected in the second COVID-19 epidemic wave.
南アフリカの最初と2番目のCOVID-19流行波での、COVID-19の毎日の平均陽性テストの差が比較的小さいことは、次のことを示唆しています。最初のCOVID-19流行波期間で検出されたSARS-CoV-2系統クラスター1(主にB.1.1.54、B.1.1.56 C.1 SARS-CoV-2系統)は、2番目のCOVID-19流行波で検出されたSARS-CoV-2系統クラスター2(主にベータ(B.1.351)SARS-CoV-2 VOC)と比較した場合、南アフリカの人口で同様のCOVID-19感染率をもたらしました。
The mean COVID-19 daily positive tests in South Africa’s third COVID-19 epidemic wave were 53.9 and 54.8 % more than those of the first and second COVID-19 epidemic wave period respectively.
南アフリカの3番目のCOVID-19流行波におけるCOVID-19の毎日の平均陽性テストは、1番目と2番目のCOVID-19流行波の期間よりもそれぞれ53.9%と54.8%多かった。
This result suggests that the SARS-CoV-2 lineage cluster 3 (predominantly Delta (B.1.617.2) SARS-CoV-2 VOC) detected in the third COVID-19 epidemic wave resulted in higher COVID-19 transmissibility in the South African population than the SARS-CoV-2 lineage clusters 1 and 2.
この結果は、3番目のCOVID-19流行波で検出されたSARS-CoV-2系統クラスター3(主にデルタ(B.1.617.2)SARS-CoV-2 VOC)が、SARS-CoV-2系統クラスター1および2よりも南アフリカの集団で高いCOVID-19感染率をもたらしたことを示唆しています。
The difference between the mean COVID-19 daily positive tests in South Africa’s first, second and third COVID-19 epidemic wave period can also be observed in Figure 2.
南アフリカの第1、第2、第3のCOVID-19流行波期間におけるCOVID-19の毎日の平均陽性テストの違いは、図2でも確認できます。
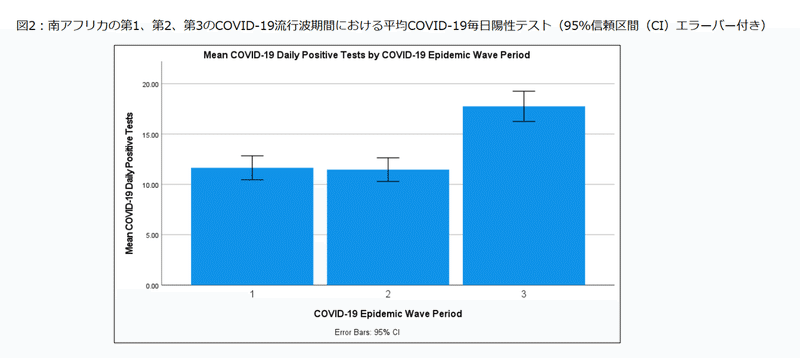
A paired T-test of the COVID-19 daily positive tests between the first and second COVID-19 epidemic wave period showed no significant difference at 95 % confidence interval between these COVID-19 epidemic periods with a p-value of 0.709 (shown in Table 9).
最初と2番目のCOVID-19流行波期間の間のCOVID-19毎日陽性テストの対応のあるT検定は、これらのCOVID-19流行期間の間の95%信頼区間で有意差を示さず、p値は0.709でした(表9に示されています)。
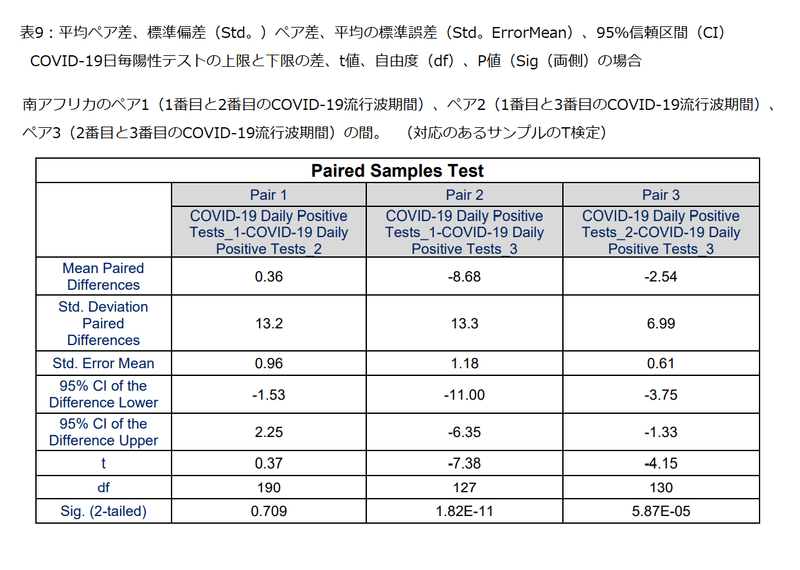
While the paired T-test of the COVID-19 daily positive tests between the Pair 2 (first and third COVID-19 epidemic wave period) and Pair 3 (second and third COVID-19 epidemic wave period) showed significant difference at 95 % confidence interval between the respective COVID-19 epidemic periods with p-values of 1.82×10⁻¹¹ and 5.87×10-05 respectively (shown in Table 9).
ペア2(1番目と3番目のCOVID-19流行波周期)とペア3(2番目と3番目のCOVID-19流行波周期)の間のCOVID-19毎日陽性テストの対応のあるT検定は、それぞれ1.82×10^-11および5.87×10^-05のp値を持つそれぞれのCOVID-19流行期間間の95%信頼区間での有意差を示しています(表9に示されています)。
3.2 Impact of SARS-CoV-2 Linages on the COVID-19 Severity in South Africa
3.2南アフリカのCOVID-19重症度に対するSARS-CoV-2系統の影響
3.2.1 Impact of SARS-CoV-2 Lineages on the COVID-19 Hospital Admissions
3.2.1SARS-CoV-2系統がCOVID-19病院への入院に与える影響
The COVID-19 hospital to active cases indicates the severity of COVID-19 based on the relative amount of COVID-19 hospitalised cases to the active cases and accounts for the covariance of active cases in hospitalised cases.
COVID-19病院から活動症例までは、COVID-19入院症例と活動症例の相対量に基づいて、COVID-19の重症度を示し、入院症例における活動症例の共分散を説明します。
According to WHO, patients with severe and critical COVID-19 are most likely to be hospitalised while those with moderate COVID-19 may present to an emergency unit or primary care/outpatient department.
WHOによると、重度で重大なCOVID-19の患者は入院する可能性が最も高く、中等度のCOVID-19の患者は救急科またはプライマリケア/外来に来院する可能性があります。
Table 10 shows the descriptive statistics for the COVID-19 hospital to active cases for the first, second and third COVID-19 epidemic wave periods in South Africa.
表10は、南アフリカでのCOVID-19の流行の波の期間の第1、第2、第3の活動的な症例に対するCOVID-19病院の記述統計を示しています。
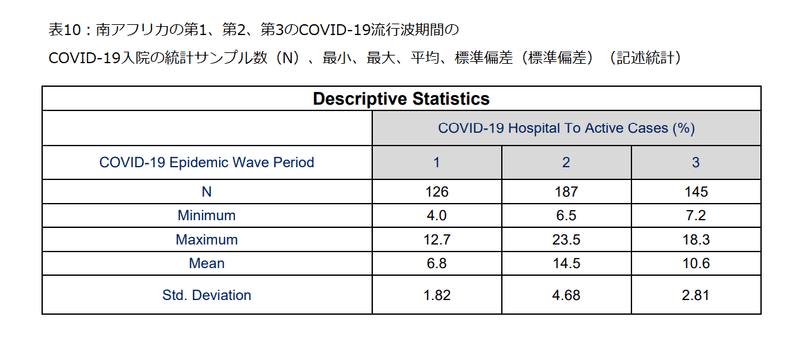
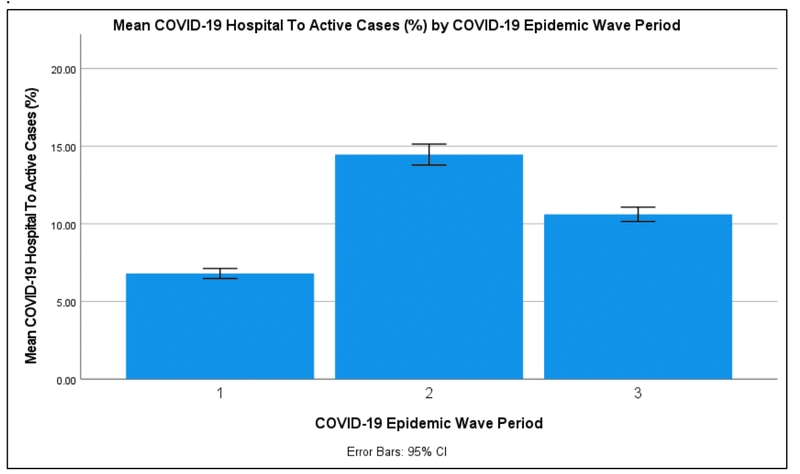
Table 10 shows that the mean COVID-19 daily hospital to active cases in South Africa’s first, second and third COVID-19 epidemic wave period were 6.8±1.82 %, 14.5±4.68 % and 10.6±2.81 % respectively.
表10は、南アフリカの第1、第2、第3のCOVID-19流行波期間における活動的な症例に対するCOVID-19の毎日の平均病院数が、それぞれ6.8±1.82%、14.5±4.68%、10.6±2.81%であることを示しています。
The second COVID-19 epidemic wave period in South Africa had the highest COVID-19 hospital to active cases followed by the third COVID-19 epidemic wave period.
南アフリカでの2番目のCOVID-19流行波期間は、活動的な症例に対して最も高いCOVID-19病院であり、3番目のCOVID-19流行波期間がそれに続きました。
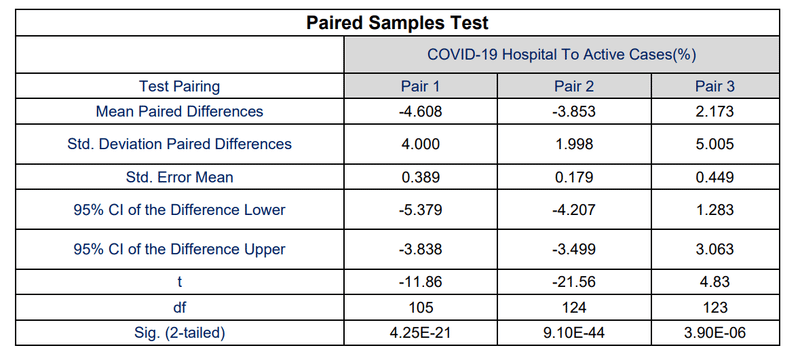
The difference of the mean COVID-19 hospital to active cases between Pair 1 (COVID-19 epidemic wave period 1 and 2), Pair 2 (COVID-19 epidemic wave period 1 and 3), Pair 3 (COVID-19 epidemic wave period 2 and 3) was 113 %, 55.8 % and 36.8 % respectively.
ペア1(COVID-19流行波期間1および2)、ペア2(COVID-19流行波周期1および3)、ペア3(COVID-19流行波期間2および3)の間のアクティブな症例に対する平均COVID-19病院の差は、それぞれ113%、55.8%、および36.8%でした。
The difference between the mean COVID-19 hospital to active cases in South Africa’s first, second and third COVID-19 epidemic wave period can also be observed in Figure 3.
南アフリカの第1、第2、第3のCOVID-19流行波期間における、平均COVID-19病院と活動症例の違いも図3で確認できます。
Paired T-tests of the COVID-19 hospital to active cases between the Pair 1, Pair 2 and Pair 3 showed significant difference at 95 % confidence interval between the respective COVID-19 epidemic periods with p-values of 4.25×10⁻²¹ , 9.10×10-44 and 3.90×10-06 respectively (shown in Table 11).
ペア1、ペア2、ペア3の間のアクティブなケースに対するCOVID-19病院の対応のあるT検定は、それぞれ4.25×10^-21、9.10×10^-44、3.90×10^-06のp値を持つそれぞれのCOVID-19流行期間の間の95%信頼区間での有意差を示しました(表11に示されています)。
The results in Section 3.2.1 suggests that the SARS-CoV lineage cluster 2 (predominantly Beta (B.1.351) SARS-CoV-2 VOC) resulted in an increase in severity of COVID-19 in the second COVID-19 epidemic wave period resulting in higher COVID-19 daily hospitalisation per active cases compared to the SARS-CoV-2 lineage clusters 1 and 3 in the first and third COVID-19 epidemic wave period in South Africa respectively.
セクション3.2.1の結果は、SARS-CoV系統クラスター2(主にベータ(B.1.351)SARS-CoV-2 VOC)が2番目のCOVID-19流行波期間でCOVID-19の重症度の増加をもたらしたことを示唆しています。その結果、南アフリカの第1および第3のCOVID-19流行波期間において、SARS-CoV-2系統クラスター1および3と比較して、活動中の症例あたりのCOVID-19の毎日の入院が高くなりました。
While the SARS-CoV lineage cluster 3 (predominantly Delta (B.1.617.2) SARS-CoV-2 VOC) resulted in an increase in severity of COVID-19 resulting in higher daily COVID-19 hospitalisation per active cases compared to the SARS-CoV-2 lineage cluster 1.
一方、SARS-CoV系統クラスター3(主にデルタ(B.1.617.2)SARS-CoV-2 VOC)は、SARS-CoV-2系統クラスター1と比較して、COVID-19の重症度を増加させ、活動中の症例あたりの1日あたりのCOVID-19入院が増加しました。
3.2.2 Impact of SARS-CoV-2 Lineages on the COVID-19 Hospital Admission Status
Table 12 shows the descriptive statistics for the COVID-19 hospital admission status for the first, second and third COVID-19 epidemic wave periods in South Africa.
表12は、南アフリカでの第1、第2、第3のCOVID-19流行波期間におけるCOVID-19入院状況の記述統計を示しています。
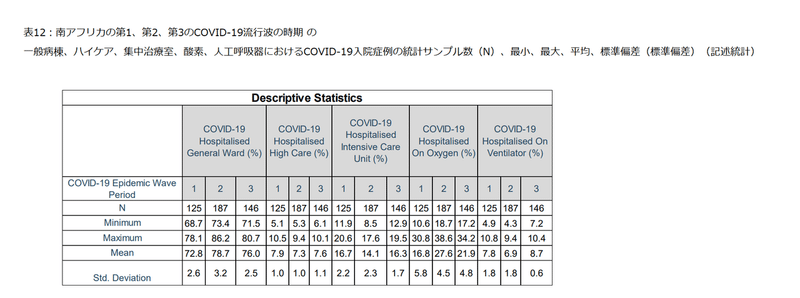
Table 12 shows that the mean COVID-19 hospitalised cases in the first COVID-19 epidemic wave period in the general ward, high care, intensive care unit, on oxygen and ventilator were 72.8±2.6 %, 7.9±1.0 %, 16.7±2.2 %, 16.8±5.8 % and 7.8±1.8 % respectively.
表12は、最初のCOVID-19流行波期間におけるCOVID-19入院症例の平均が、それぞれ一般=72.8±2.6%、ハイケア=7.9±1.0%、集中治療室=16.7±2.2%、酸素吸入=16.8±5.8%、人工呼吸器=7.8±1.8%であることを示しています。
The mean COVID-19 hospitalised cases in the second COVID-19 epidemic wave period in the general ward, high care, intensive care unit, on oxygen and ventilator were 78.7±3.2 %, 7.3±1.0 %, 14.1±2.3 %, 27.6±4.5 % and 6.9±1.8 % respectively.
第2のCOVID-19流行波期間におけるCOVID-19入院症例の平均は、それぞれ一般=78.7±3.2%、ハイケア=7.3±1.0%、集中治療室=14.1±2.3%、酸素吸入=27.6±4.5%、人工呼吸器=6.9±1.8%であることを示しています。
While the mean COVID-19 hospitalised cases in the third COVID-19 epidemic wave period in the general ward, high care, intensive care unit, on oxygen and ventilator were 76.0±2.5 %, 7.6±1.1 %, 16.3±1.7 %, 21.9±4.8 % and 8.7±0.6 % respectively.
第3のCOVID-19流行波期間におけるCOVID-19入院症例の平均は、それぞれ一般=76.0±2.5%、ハイケア=7.6±1.1%、集中治療室=16.3±1.7%、酸素吸入=21.9±4.8%、人工呼吸器=8.7±0.6%であることを示しています。
Figure 4 shows the COVID-19 hospital admission status profile in the first, second and third COVID-19 epidemic wave periods in South Africa.
図4は、南アフリカでの第1、第2、第3のCOVID-19流行波期間におけるCOVID-19入院状況プロファイルを示しています。
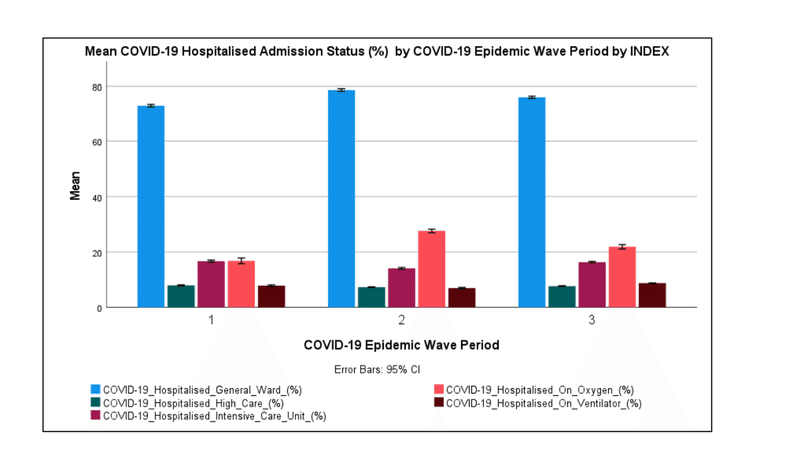
Figure 4 shows that most COVID-19 hospitalised cases in South Africa were hospitalised in the general ward (72.8-78.7 %).
図4は、南アフリカでCOVID-19に入院したほとんどの症例が一般病棟に入院したことを示しています(72.8〜78.7%)。
Figure 4 also shows that the COVID-19 patients on Oxygen were the second-largest admission status (16.8-27.6 %) followed by the COVID-19 patients in the intensive care unit (14.1-16.7 %).
図4は、酸素を使用しているCOVID-19患者が2番目に大きいのが入院状態(16.8-27.6%)であり、集中治療室のCOVID-19患者(14.1-16.7%)がそれに続くことも示しています。
The COVID-19 patients on oxygen in the second and third COVID-19 epidemic wave period were higher than those observed in the first COVID-19 epidemic wave period with those in the second COVID-19 epidemic wave period being the highest.
2番目と3番目のCOVID-19流行波期間の酸素に関するCOVID-19患者は、最初のCOVID-19流行波期間で観察された患者よりも高く、2番目のCOVID-19流行波期間の患者が最も高かった。
Paired T-tests of the mean COVID-19 hospital admission status in the Pair 1, Pair 2 and Pair 3 showed significant difference at 95 % confidence interval between the respective COVID-19 epidemic periods with p-values in the range of 2.86×10-41 to 0.00219 respectively (shown in Table 13).
ペア1、ペア2、およびペア3の平均COVID-19入院状態の対応のあるT検定は、それぞれ2.86×10^-41から0.00219の範囲のp値を持つそれぞれのCOVID-19流行期間の間の95%信頼区間での有意差を示しています(表13に示されている)。
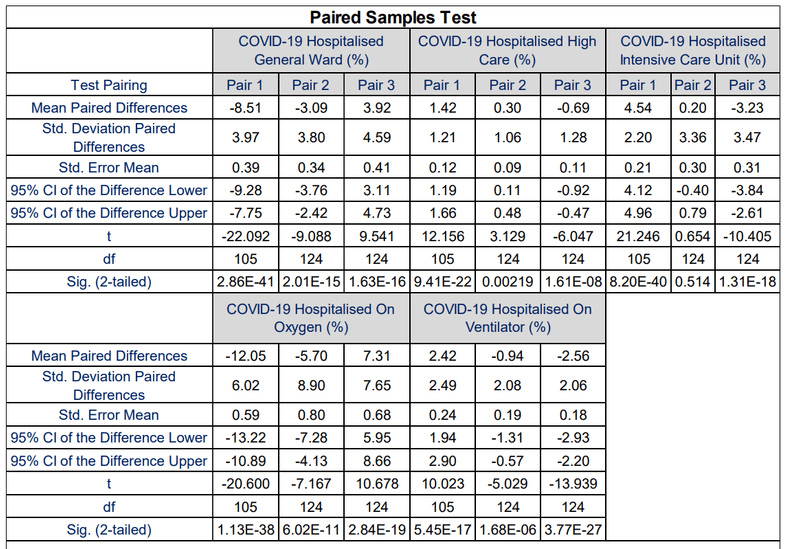
Table 13 shows that the COVID19 patients admitted in the intensive care unit in the first and third COVID-19 epidemic wave period were not significantly different at a 95 % confidence interval with a p-value of 0.514.
表13は、1回目と3回目のCOVID-19流行波期間に集中治療室に入院したCOVID19患者は、95%信頼区間でp値0.514で有意差がなかったことを示しています。
The results in Section 3.2.2 suggest that the SARS-CoV-2 lineage clusters observed in the first, second and third COVID-19 epidemic wave periods in South Africa resulted in a similar distribution of the COVID-19 hospital admission status profile however the mean COVID-19 admission status was significantly different at 95 % confidence interval.
セクション3.2.2の結果は、次のことを示しています。南アフリカの第1、第2、第3のCOVID-19流行波期間で観察された、SARS-CoV-2系統クラスターは、COVID-19入院状態プロファイルの同様の分布をもたらしました。ただし、平均COVID-19入院状況は、95%信頼区間で有意に異なっていました。
The results also show that the SARS-CoV-2 lineage cluster 1 (predominantly B.1.1.54, B.1.1.56 C.1 SARS-CoV-2 lineages) and SARS-CoV-2 lineage cluster 3 (predominantly Delta (B.1.617.2) SARS-CoV-2 VOC) resulted in the same COVID-19 patients admitted in the intensive care unit relative to the total COVID-19 hospital admitted cases at 95 % confidence interval.
結果はまた、SARS-CoV-2系統クラスター1(主にB.1.1.54、B.1.1.56 C.1 SARS-CoV-2系統)とSARS-CoV-2系統クラスター3(主にデルタ(B.1.617.2)SARS-CoV-2 VOC)が、95%信頼区間において、COVID-19病院に入院した症例の総数と比較して、集中治療室に入院した同じCOVID-19患者をもたらしたことを示しています。
The SARS-CoV-2 lineage cluster 2 (predominantly Beta (B.1.351) SARS-CoV-2 VOC) was observed to have resulted in higher COVID-19 patients on oxygen than the SARS-CoV-2 lineage clusters 1 and 3.
SARS-CoV-2系統クラスター2(主にベータ(B.1.351)SARS-CoV-2 VOC)は、SARS-CoV-2系統クラスター1および3よりも酸素中のCOVID-19患者が多いことが観察されました。
3.2.3 Impact of SARS-CoV-2 Lineages on the COVID-19 Hospital Admission Age Profile
Table 14 shows the descriptive statistics for the COVID-19 hospital admission age profile for the first, second and third COVID-19 epidemic wave periods in South Africa.
表14は、南アフリカでの1回目、2回目、3回目のCOVID-19流行波期間のCOVID-19入院年齢プロファイルの記述統計を示しています。
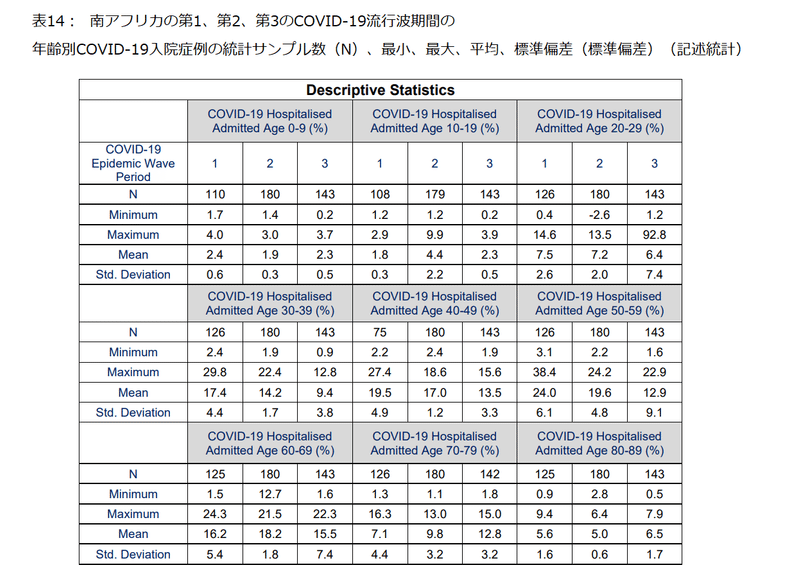
Table 14 shows that the mean COVID-19 hospitalised cases in the first COVID-19 epidemic wave period in the ages of 0 to 9, 10 to 19, 20 to 29, 30 to 39, 40 to 49, 50 to 59, 60 to 69, 70 to 79 and 80 to 89 years were 2.4±0.6 %, 1.8±0.3 %, 7.5±2.6 %, 17.4±4.4 %, 19.5±4.9 %, 24.0±6.1 %, 16.2±5.4 %, 7.1±4.4 % and 5.6±1.6 % respectively.
表14は、最初のCOVID-19流行波期間におけるCOVID-19入院症例の平均が、それぞれ0-9歳=2.4±0.6%、10-19歳=1.8±0.3%、20-29歳=7.5±2.6%、30-39歳=17.4±4.4%、40-49歳=19.5±4.9%、50-59歳=24.0±6.4%、60-69歳=16.2±5.4%、70-79歳=7.1±4.4%、80-89歳=5.6±1.6%であることを示しています。
The mean COVID-19 hospitalised cases in the second COVID-19 epidemic wave period in the ages of 0 to 9, 10 to 19, 20 to 29, 30 to 39, 40 to 49, 50 to 59, 60 to 69, 70 to 79 and 80 to 89 years were 1.9±0.3 %, 4.4±2.2 %, 7.2±2.0 %, 14.2±1.7 %, 17.0±1.2 %, 19.6±4.8 %, 18.2±1.8 %, 9.8±3.2 % and 5.0±0.6 % respectively.
第2のCOVID-19流行波期間におけるCOVID-19入院症例の平均は、それぞれ0-9歳=1.9±0.3%、10-19歳=4.4±2.2%、20-29歳=7.2±2.0%、30-39歳=14.2±1.7%、40-49歳=17.0±1.2%、50-59歳=19.6±4.8%、60-69歳=18.2±1.8%、70-79歳=9.8±3.2%、80-89歳=5.0±0.6%であることを示しています。
While, the mean COVID-19 hospitalised cases in the third COVID-19 epidemic wave period in the ages of 0 to 9, 10 to 19, 20 to 29, 30 to 39, 40 to 49, 50 to 59, 60 to 69, 70 to 79 and 80 to 89 years were 2.3±0.5 %, 2.3±0.5 %, 6.4±7.4 %, 9.4±3.8 %, 13.5±3.3 %, 12.9±9.1 %, 15.5±7.4 %, 12.8±3.2 % and 6.5±1.7 % respectively.
一方、第3のCOVID-19流行波期間におけるCOVID-19入院症例の平均は、それぞれ0-9歳=2.3±0.5%、10-19歳=2.3±0.5%、20-29歳=6.4±7.4%、30-39歳=9.4±3.8%、40-49歳=13.5±3.3%、50-59歳=12.9±9.1%、60-69歳=15.5±7.4%、70-79歳=12.8±3.2%、80-89歳=6.5±1.7%であることを示しています。
Figure 5 shows the COVID-19 hospital admission age profile in the first, second and third COVID-19 epidemic wave periods in South Africa.
図5は、南アフリカでの第1、第2、第3のCOVID-19流行波期間におけるCOVID-19入院年齢プロファイルを示しています。
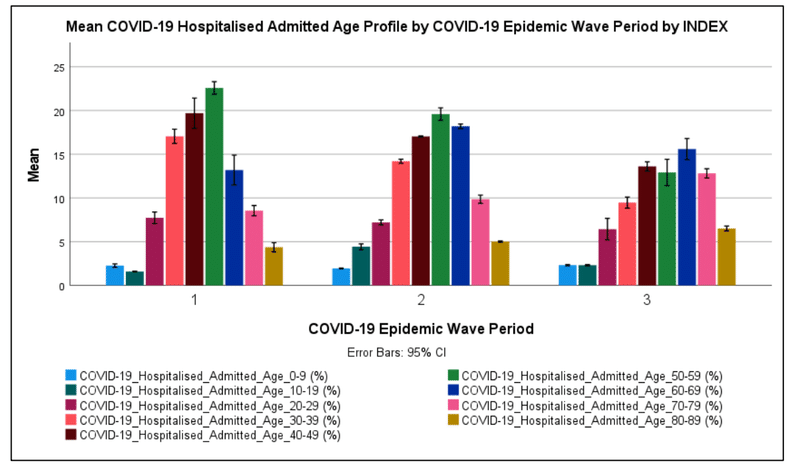
Figure 5 shows that most COVID-19 hospitalised cases in South Africa’s first, second and third COVID-19 epidemic wave period were in the ages of 50 to59 (19.6 %), 50 to 59 (24.0 %) and 60 to 69 (15.5 %) years respectively.
図5は、南アフリカの第1、第2、第3のCOVID-19流行波期間における、ほとんどのCOVID-19入院症例が、50〜59歳(19.6%)、50〜59歳(24.0%)、60〜69歳(15.5%)であったことを示しています。
COVID-19 patients in the age groups of 40 to 49 were the second-largest admitted age groups in the first and third COVID-19 epidemic wave period (14.1-16.7 %) while for the second COVID-19 epidemic wave period it was the age group of 60 to 69 years (18.2 %).
40〜49歳のCOVID-19患者は、1回目と3回目のCOVID-19流行波期間で2番目に入院した年齢層でした(14.1-16.7%)。一方、2回目のCOVID-19流行波の期間は、60〜69歳(18.2%)の年齢層でした。
COVID-19 admitted patients in the age groups of 0 to 19 years were relatively low (1.8 to 4.4 %) and highest in the second COVID-19 epidemic wave period.
COVID-19に入院した0〜19歳の患者は比較的低く(1.8〜4.4%)、2回目のCOVID-19流行の波の期間で最も高かった。
The incidence of COVID-19 in children has been reported to be low around the world particularly severe and critical COVID-19 requiring hospitalisation.
小児におけるCOVID-19の発生率は、特に入院を必要とする重症で重大なCOVID-19では、世界中で低いと報告されています。
Figure 5 shows that the COVID-19 hospital admitted age profile for the first and second COVID-19 epidemic wave period was relative normally distributed, while the distribution in the third COVID epidemic wave period was left-skewed with increased incidence in the age groups over 70 years.
図5は、COVID-19病院が認めた、最初と2番目のCOVID-19流行波期間の年齢プロファイルが比較的正規分布していたことを示しています。一方、第3COVID流行波期間の分布は左に歪んでおり、70歳以上の年齢層で発生率が増加しています。
In general, paired T-tests of the COVID-19 hospital admission age profile in Pair 1, Pair 2 and Pair 3 showed significant differences at 95 % confidence interval between the respective COVID-19 epidemic periods with p-values in the range of 7.66×10-44 to 0.040 respectively (shown in Table 15).
一般に、ペア1、ペア2、およびペア3のCOVID-19入院年齢プロファイルの対応のあるT検定は、7.66×10^-44から0.040の範囲のp値を持つそれぞれのCOVID-19流行期間の間の95%信頼区間での有意差を示しました(表15に示されている)。
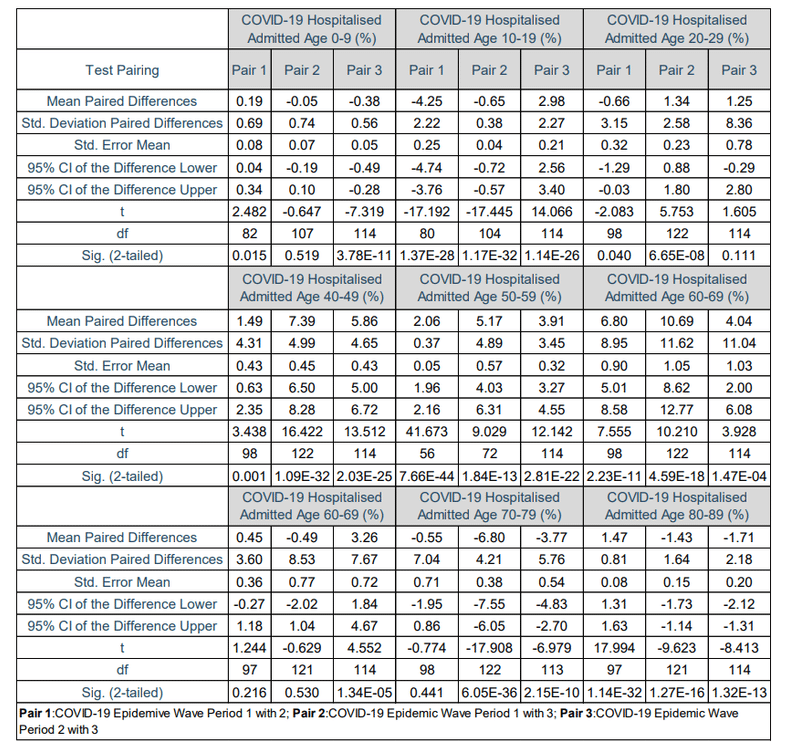
However, Table 15 also shows that the COVID-19 patients admitted in age group 0 to 9 years in first and third COVID-19 epidemic wave periods, age group 20 to 29 years in second and third COVID-19 epidemic wave periods, age group 60 to 69 years in first and, second and third COVID-19 epidemic wave periods, age group 70 to 79 years in first and second COVID-19 epidemic wave periods were significant similar at 95 confidence interval with p-values of 0.111 to 0.530.
ただし、表15は、次のことも示しています。0.111から0.530のp値で95信頼区間で、入院したCOVID-19患者は、0〜9歳の年齢層(COVID-19の流行波の第1および第3の期間)、20〜29歳の年齢層(COVID-19の流行波の第2および第3の期間)、60〜69歳の年齢層(COVID-19の流行波の第1・第2・第3の期間)、70〜69歳の年齢層(COVID-19の流行波の第1および第2の期間)は、類似していた。
The results in Section 3.2.3 suggest that the SARS-CoV-2 lineage clusters observed in the first, second and third COVID-19 epidemic wave periods in South Africa resulted in different distributions of the COVID-19 hospital admission age profile.
セクション3.2.3の結果は、南アフリカの第1、第2、第3のCOVID-19流行波期間で観察されたSARS-CoV-2系統クラスターが、COVID-19入院年齢プロファイルの異なる分布をもたらしたことを示唆しています。
The results also show that the SARS-CoV-2 lineage cluster 3 (predominantly Delta (B.1.617.2) resulted in an increased incidence in COVID-19 patients in the age groups over 70 years compared to the SARS SARS-CoV-2 lineage cluster 1 (predominantly B.1.1.54, B.1.1.56 C.1 SARS-CoV-2 lineages) and the SARS-CoV-2 lineage cluster 2 (predominantly Beta (B.1.351) SARS-CoV-2 VOC).
結果はまた次のことを示しています。 SARS-CoV-2系統クラスター3(主にデルタ(B.1.617.2)は、SARS SARS-CoV-2系統クラスター1(主にB.1.1.54、B.1.1.56 C.1 SARS-CoV-2系統)およびSARS-CoV-2系統クラスター2(主にベータ(B.1.351)SARS-CoV-2 VOC)と比較して、70歳以上の年齢層のCOVID-19患者の発生率を増加させました。
3.2.4 Impact of SARS-CoV-2 Lineages on the COVID-19 Hospital Deaths Age Profile
3.2.4COVID-19病院の死亡年齢プロファイルに対するSARS-CoV-2系統の影響
Table 16 shows the descriptive statistics for the COVID-19 hospital death age profile for the first, second and third COVID-19 epidemic wave periods in South Africa.
表16は、南アフリカでの1回目、2回目、3回目のCOVID-19流行波期間のCOVID-19病院死亡年齢プロファイルの記述統計を示しています。
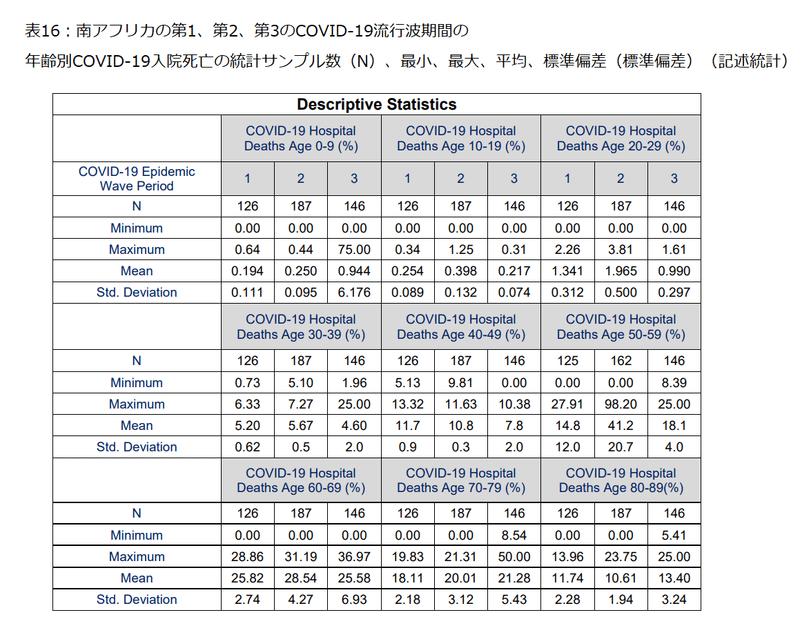
Table 16 shows that the mean COVID-19 hospitalised deaths in the first COVID-19 epidemic wave period in the ages of 0 to 9, 10 to 19, 20 to 29, 30 to 39, 40 to 49, 50 to 59, 60 to 69, 70 to 79 and 80 to 89 years were 0.194±0.111 %, 0.254±0.089 %, 1.34±0.312 %, 5.20±0.62 %, 11.7±0.9 %, 14.8±12.0 %, 25.8±2.74 %, 18.1±2.18 % and 11.7±2.28 % respectively.
表16は、最初のCOVID-19流行波期間におけるCOVID-19入院死亡の平均が、それぞれ0-9歳=0.194±0.111%、10-19歳=0.254±0.089%、20-29歳=1.34±0.312%、30-39歳=5.20±0.62%、40-49歳=11.7±0.9%、50-59歳=14.8±12.0%、60-69歳=25.8±2.74%、70-79歳=18.1±2.18%、80-89歳=11.7±2.28%であることを示しています。
The mean COVID-19 hospitalised deaths in the second COVID-19 epidemic wave period in the ages of 0 to 9, 10 to 19, 20 to 29, 30 to 39, 40 to 49, 50 to 59, 60 to 69, 70 to 79 and 80 to 89 years were 0.250±0.095 %, 0.398±0.132 %, 1.97±0.500 %, 5.67±0.5 %, 10.8±0.3 %, 41.2±20.7 %, 28.5±4.27 %, 20.0±3.12 % and 10.6±1.94 % respectively.
第2のCOVID-19流行波期間におけるCOVID-19入院死亡の平均は、それぞれ0-9歳=0.250±0.095%、10-19歳=0.398±0.132%、20-29歳=1.97±0.500%、30-39歳=5.67±0.5%、40-49歳=10.8±0.3%、50-59歳=41.2±20.7%、60-69歳=28.5±4.27%、70-79歳=20.0±3.12%、80-89歳=10.6±1.94%であることを示しています。
While, the mean COVID-19 hospitalised deaths in the third COVID-19 epidemic wave period in the ages of 0 to 9, 10 to 19, 20 to 29, 30 to 39, 40 to 49, 50 to 59, 60 to 69, 70 to 79 and 80 to 89 years were 0.944±6.18 %, 0.217±0.074 %, 0.990±0.297 %, 4.60±2.0 %, 7.8±2.0 %, 18.1±4.0 %, 25.6±6.93 %, 21.3±5.43 % and 13.4±3.24 % respectively.
一方、第3のCOVID-19流行波期間におけるCOVID-19入院死亡の平均は、それぞれ0-9歳=0.944±6.18%、10-19歳=0.217±0.074%、20-29歳=0.990±0.297%、30-39歳=4.60±2.0%、40-49歳=7.8±2.0%、50-59歳=18.1±4.0%、60-69歳=25.6±6.93%、70-79歳=21.3±5.43%、80-89歳=13.4±3.24%であることを示しています。
Figure 5 Figure 6 shows the COVID-19 hospital death age profile in the first, second and third COVID-19 epidemic wave periods in South Africa.
図6は、南アフリカでの第1、第2、第3のCOVID-19流行波期間におけるCOVID-19病院の死亡年齢プロファイルを示しています。
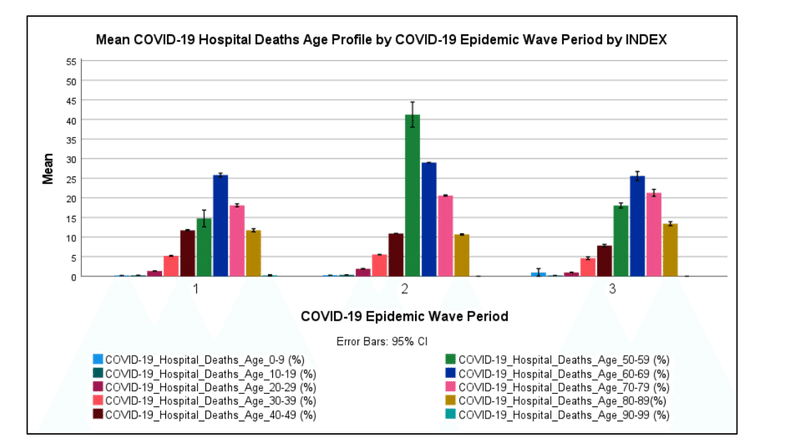
Figure 6 shows that most COVID-19 hospitalised deaths in South Africa in the first, second and third COVID-19 epidemic wave period were in the ages of 60 to 69 (25.8 %), 50 to 59 (41.2 %) and 60 to 69 (25.6 %) years respectively.
図6は、南アフリカで第1、第2、第3のCOVID-19流行波の期間に入院したほとんどのCOVID-19による死亡は、60〜69歳(25.8%)、50〜59歳(41.2%)、60〜69歳(25.6%)であったことを示しています。
COVID-19 hospitalised deaths in the age groups of 70 to 79 were the second-largest death age groups in the first and third COVID-19 epidemic wave period (18.1-21.3 %) while for the second COVID-19 epidemic wave period it was the age group of 60 to 69 years (28.5 %).
70〜79歳のCOVID-19入院死亡は、第1および第3のCOVID-19流行波期間で2番目に大きい死亡年齢グループでした(18.1-21.3%)。一方、2回目のCOVID-19流行波の期間は、60〜69歳(28.5%)の年齢層でした。
COVID-19 hospitalised deaths in the age groups of 0 to 29 years were relatively low (0.194 to 1.97 %).
0〜29歳の年齢層でのCOVID-19の入院による死亡は比較的少なかった(0.194〜1.97%)。
The incidence of COVID-19 deaths in children has been reported to be low around the world.
子供のCOVID-19による死亡の発生率は、世界中で低いと報告されています。
Figure 6 shows that the COVID-19 hospitalised death age profile for the first, second and third COVID-19 epidemic wave periods were similar in distribution except for the high incidence of COVID-19 hospitalised deaths in the age group of 50 to 59 in the second COVID-19 epidemic wave period.
図6は、第1、第2、第3のCOVID-19流行波期間のCOVID-19入院死亡年齢プロファイルの分布が類似していたことを示しています。ただし、COVID-19の流行の第2波の期間に、50〜59歳の年齢層でCOVID-19に入院した死亡の発生率が高いことを除きます。
In general, paired T-tests of the mean COVID-19 hospitalised deaths age groups between the Pair 1, Pair 2 and Pair 3 showed significant difference at 95 % confidence interval between the respective COVID-19 epidemic periods with p-values in the range of 5.04×10-40 to 0.00238 respectively (shown in Table 17).
一般に、ペア1、ペア2、ペア3の間の平均COVID-19入院死亡年齢グループの対応のあるT検定は、 それぞれ5.04×10^-40から0.00238の範囲のp値を持つそれぞれのCOVID-19流行期間の間の95%信頼区間での有意差を示しています(表17に示されています)。
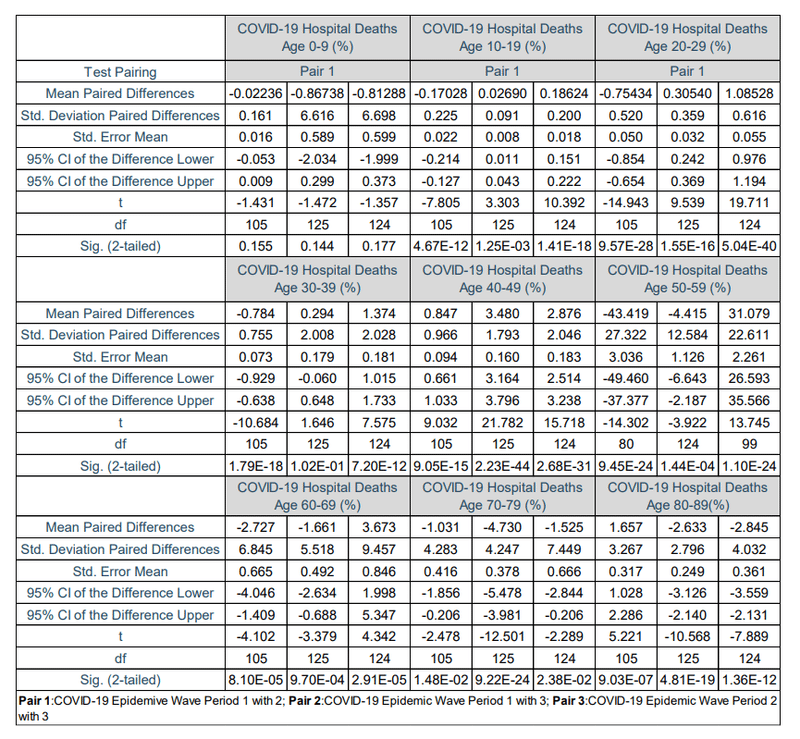
Table 17 shows that the COVID-19 hospitalised deaths in age groups of 0 to 9 years in the first, second and third COVID-19 epidemic wave period were not significantly different at a 95 % confidence interval with p-values of 0.144 to 0.177.
表17は、第1、第2、第3のCOVID-19流行波期間における0〜9歳の年齢層でのCOVID-19入院死亡は、p値が0.144〜0.177の95%信頼区間で有意差がなかったことを示しています。
Table 18 shows the cumulative COVID-19 death risk ratio for South African COVID-19 hospital death age groups for the first, second and third COVID-19 epidemic wave period in South Africa regarding the age group of 0 to 9 years.
表18は、0〜9歳の年齢層に関する、南アフリカでの第1、第2、第3のCOVID-19流行波期間における、南アフリカのCOVID-19病院死亡年齢層の累積COVID-19死亡リスク比を示しています。
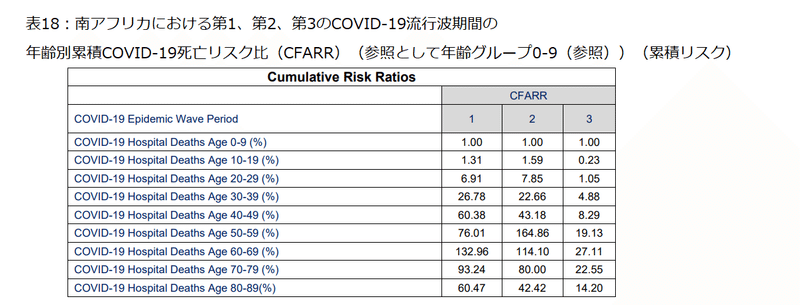
The cumulative risk of death in COVID-19 hospitalised deaths increased with increasing age group groups with age groups of 50 to 69 years having the highest risk.
COVID-19で入院した死亡の累積死亡リスクは、年齢層グループが増えるにつれて増加し、50〜69歳の年齢層が最もリスクが高くなりました。
The results in Section 3.2.4 suggest that the SARS-CoV-2 lineage clusters observed in the first, second and third COVID-19 epidemic wave periods in South Africa resulted in similar distributions of the COVID-19 hospitalised death age profile.
セクション3.2.4の結果は、南アフリカの第1、第2、第3のCOVID-19流行波期間で観察されたSARS-CoV-2系統クラスターが、COVID-19入院死亡年齢プロファイルの同様の分布をもたらしたことを示唆しています。
The results also show that the SARS-CoV-2 lineage cluster 2 (predominantly Beta (B.1.351) SARS-CoV-2 VOC) resulted in an increase in the incident of hospitalised deaths in age groups of 50 to 59 compared to SARS-CoV-2 lineage cluster 1 (predominantly B.1.1.54, B.1.1.56 C.1 SARS-CoV-2 lineages) and SARS-CoV-2 lineage cluster 3 (predominantly Delta (B.1.617.2) SARS-CoV-2 VOC).
結果はまた、SARS-CoV-2系統クラスター1(主にB.1.1.54、B.1.1.56 C.1 SARS-CoV-2系統)およびSARS-CoV-2系統クラスター3(主にデルタ(B.1.617.2)SARS-CoV-2 VOC)と比較して、SARS-CoV-2系統クラスター2(主にベータ版(B.1.351)SARS-CoV-2 VOC)が50〜59歳の年齢層で入院死亡の発生率の増加をもたらしたことを示しています。
3.2.5 Impact of SARS-CoV-2 Lineages on the CFR, DR and ECDR
3.2.5 CFR、DRおよびECDRに対するSARS-CoV-2系統の影響
Table 19 shows the descriptive statistics for the COVID-19 hospital case fatality rate (COVID-19 CRF), hospital discharge rate (COVID-19 DR), natural deaths, excess natural deaths, weekly reported COVID-19 deaths and the weekly unreported excess deaths (natural) to COVID-19 death ratio (ECDR) for the first, second and third COVID-19 epidemic wave periods in South Africa.
表19は、南アフリカでの第1、第2、第3のCOVID-19流行波の期間において、COVID-19の致死率(COVID-19 CRF)、退院率(COVID-19 DR)、自然死、過剰自然死、毎週報告されているCOVID-19による死亡、および毎週報告されていない過剰死亡(自然)とCOVID-19による死亡率(ECDR)を示しています。
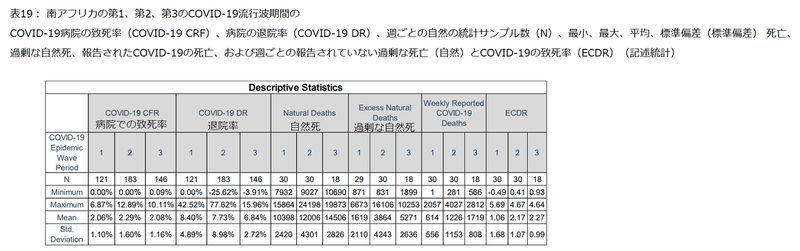
Table 19 shows that the mean COVID-19 hospital case fatality rate in South Africa’s first, second and third COVID-19 epidemic wave periods were 2.06±1.10 %, 2.29±1.60 % and 2.08±1.16 % respectively.
表19は、南アフリカの第1、第2、第3のCOVID-19流行波期間における平均COVID-19致死率が、それぞれ2.06±1.10%、2.29±1.60%、2.08±1.16%であることを示しています。
The mean COVID-19 hospital discharge rate in South Africa’s first, second and third COVID-19 epidemic wave periods were 8.40±4.89 %, 7.73±8.89 % and 6.84±2.72 % respectively.
南アフリカの第1、第2、第3のCOVID-19流行波期間における平均COVID-19退院率は、それぞれ8.40±4.89%、7.73±8.89%、6.84±2.72%でした。
The mean weekly natural deaths in South Africa’s first, second and third COVID-19 epidemic wave period were 10 398±2 420, 12 006±4 301 and 14 506±2 826 respectively.
南アフリカの第1、第2、第3のCOVID-19流行波期間における週平均の自然死は、それぞれ10398±2420、12006±4301、14506±2826でした。
The mean weekly excess natural deaths in South Africa’s first, second and third COVID-19 epidemic wave period were 1 619±2 110, 3 864±4 243 and 5 271±2 636 respectively.
南アフリカの第1、第2、第3のCOVID-19流行波期間における週平均の過剰自然死は、それぞれ1 619±2110、3864±4243、5271±2636でした。
The mean weekly reported COVID-19 deaths in South Africa’s first, second and third COVID-19 epidemic wave period were 614±556, 1 226±1 153 and 1 719±808 respectively.
南アフリカの第1、第2、第3のCOVID-19流行波期間で毎週報告されたCOVID-19による死亡の平均は、それぞれ614±556、1226±1153、1719±808でした。
The Weekly Unreported Excess Deaths (Natural) to COVID-19 Death Ratio (ECDR) allows for the accounting of potential COVID-19 pandemic related natural deaths that are not reported.
毎週の未報告の過剰死亡(自然)とCOVID-19の死亡率(ECDR)により、報告されていない潜在的なCOVID-19パンデミック関連の自然死亡を考慮することができます。
Table 19 shows the mean ECDR in South Africa’s first, second and third COVID-19 epidemic wave period were 1.06±1.68, 2.17±1.07 and 2.27±0.99 respectively.
表19は、南アフリカの1回目、2回目、3回目のCOVID-19流行波周期の平均ECDRが、それぞれ1.06±1.68、2.17±1.07、2.27±0.99であることを示しています。
These results suggest that the number of excess natural deaths not accounted for in the COVID-19 reported deaths were the same as the COVID-19 reported deaths in the first COVID-19 epidemic wave period and twice the COVID-19 reported deaths in the second and third COVID-19 epidemic wave period.
これらの結果は、次のことを示唆しています。COVID-19で報告された死亡数に含まれていない過剰な自然死亡数は、COVID-19で報告された最初のCOVID-19流行波期間での死亡数と同じ、COVID-19で報告された2番目と3番目のCOVID流行波期間での死亡数の2倍でした。
Paired T-tests of the COVID-19 hospital case fatality rate in Pair 1, Pair 2 and Pair 3 showed no significant difference at 99 % confidence interval with p-values of 0.028, 0.431 and 0.146 respectively (shown in Table 20).
ペア1、ペア2、ペア3のCOVID-19病院の致死率の対応のあるT検定では、99%の信頼区間で、それぞれ0.028、0.431、0.146のp値で有意差は示されませんでした(表20を参照)。
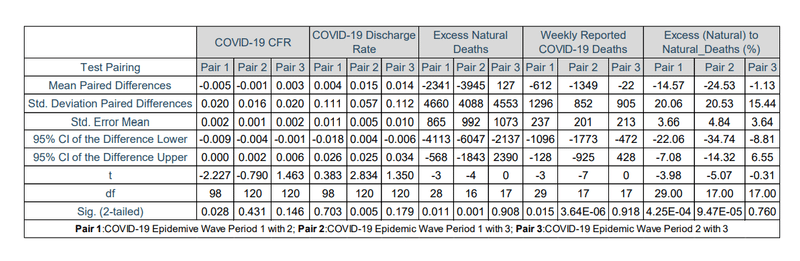
This result suggests that the mean COVID-19 hospital case fatality rates in South Africa’s three COVID-19 epidemic wave periods were statistically similar.
この結果は、南アフリカの3つのCOVID-19流行波期間におけるCOVID-19病院の平均致死率が統計的に類似していたことを示唆しています。
Paired T-tests of the COVID-19 hospital discharge rate in Pair 1 and Pair 3 showed no significant difference at 95 % confidence interval with p-values of 0.703 and 0.179 respectively (shown in Table 20).
ペア1とペア3のCOVID-19退院率の対応のあるT検定では、95%信頼区間で有意差は見られず、p値はそれぞれ0.703と0.179でした(表20を参照)。
While the paired T-test in Pair 2 showed a significant difference at a 95 % confidence interval with a p-value of 0.005.
一方、ペア2の対応のあるT検定では、95%の信頼区間で有意差が示され、p値は0.005でした。
This result suggests that the mean COVID-19 hospital discharge rate in the first and second, second and third COVID-19 epidemic wave periods were statistically similar while that between the first and third COVID-19 wave periods were different.
この結果は、第1、第2、第2、第3のCOVID-19流行波期間における平均COVID-19退院率は統計的に類似していたが、第1と第3のCOVID-19波期間の間は異なっていたことを示唆しています。
Paired T-tests of the excess natural deaths, weekly reported COVID-19 deaths and ECDR in Pair 3 showed no significant difference at 95 % confidence interval with p-values of 0.908, 0.918 and 0.760 respectively (shown in Table 20).
過剰な自然死、毎週報告されたCOVID-19死、およびペア3のECDRの対応のあるT検定では、95%信頼区間で有意差はなく、p値はそれぞれ0.908、0.918、0.760でした(表20を参照)。
While the paired T-test in Pair 1 and Pair 2 showed a significant difference at a 95 % confidence interval with p-values in the range of 0.001 and 3.64×10-06 to 0.015 (shown in Table 20).
一方、ペア1とペア2の対応のあるT検定では、95%の信頼区間で有意差が示され、p値は0.001および3.64×10^-06から0.015の範囲でした(表20を参照)。
These result ssuggest that the mean excess natural deaths weekly reported COVID-19 deaths and ECDR in the second and third COVID-19 epidemic wave periods were statistically similar while that between the first and third, first and second COVID-19 wave periods were statistically different.
これらの結果は、毎週報告されたCOVID-19の平均過剰自然死と、2番目と3番目のCOVID-19流行波期間におけるECDRが統計的に類似していたことを示唆しています。一方、第1と第3の間、第1と第2のCOVID-19波周期は統計的に異なっていました。
The results in Section 3.2.5 suggest that the SARS-CoV-2 lineage clusters identified in the first, second and third COVID-19 epidemic wave periods in South Africa resulted in similar COVID-19 hospital case-fatality rates.
セクション3.2.5の結果は、南アフリカの第1、第2、第3のCOVID-19流行波期間で特定されたSARS-CoV-2系統クラスターが、同様のCOVID-19病院の致死率をもたらしたことを示唆しています。
The SARS-CoV-2 lineage cluster 2 (predominantly Beta (B.1.351) SARS-CoV-2 VOC) and the SARS-CoV-2 lineage cluster 3 (predominantly Delta (B.1.617.2) SARS-CoV-2 VOC) resulted in similar COVID-19 discharge rates, excess natural deaths, weekly reported COVID-19 deaths and ECDR.
SARS-CoV-2系統クラスター2(主にベータ(B.1.351)SARS-CoV-2 VOC)およびSARS-CoV-2系統クラスター3(主にデルタ(B.1.617.2)SARS-CoV-2 VOC) )同様のCOVID-19排出率、過剰な自然死、毎週報告されたCOVID-19死、およびECDRをもたらしました。
While, the SARS-CoV-2 lineage cluster 1 (predominantly B.1.1.54, B.1.1.56 C.1 SARS-CoV-2 lineages) resulted in statistically different excess natural deaths, weekly reported COVID-19 deaths and ECDR relative to the aforementioned SARS-CoV-2 clusters.
一方、SARS-CoV-2系統クラスター1(主にB.1.1.54、B.1.1.56 C.1 SARS-CoV-2系統)は、前述のSARS-CoV-2クラスターと比較して、統計的に異なる過剰な自然死、毎週報告されたCOVID-19死、およびECDRをもたらしました。
4. Conclusions
Based on the COVID-19 detection rate in South Africa, the SA SARS-CoV-2 lineage cluster 3 which was predominantly the Delta (B.1.617.2) SARS-CoV-2 VOC resulted in an increase in the COVID-19 transmissibility in the South African population by 53.9 to 54.8 %.
南アフリカでのCOVID-19検出率に基づくと、主にデルタ(B.1.617.2)SARS-CoV-2VOCであったSASARS-CoV-2系統クラスター3により、南アフリカの人口のCOVID-19伝染率が53.9〜54.8%増加しました。
This is relative to the SA SARS-CoV-2 lineage cluster 1 (predominantly B.1.1.54, B.1.1.56 C.1 SARS-CoV-2 lineages) and the SA SARS-CoV-2 lineage cluster 2 (predominantly Beta (B.1.351) SARS-CoV-2 VOC) respectively.
これは、それぞれSASARS-CoV-2系統クラスター1(主にB.1.1.54、B.1.1.56 C.1 SARS-CoV-2系統)およびSASARS-CoV-2系統クラスター2(主にベータ(B.1.351)SARS-CoV-2 VOC)との関連性においてです。
The SA SARS-CoV-2 lineage cluster 1 and 2 resulted in similar COVID-19 transmissibility in the South African population.
SA SARS-CoV-2系統クラスター1および2は、南アフリカの人口で同様のCOVID-19感染率をもたらしました。
Based on the daily COVID-19 hospitalisations per active case, the SA SARS-CoV-2 lineage cluster 2 (predominantly the Beta (B.1.351) SARS-CoV-2 VOC) was observed to result in increased hospitalisation relative to the SA SARS-CoV-2 lineage clusters 1 and 3.
アクティブなケースごとの毎日のCOVID-19入院に基づいて、SA SARS-CoV-2系統クラスター2(主にベータ(B.1.351)SARS-CoV-2 VOC)は、SASARS-CoV-2系統クラスター1および3と比較して入院の増加をもたらすことが観察されました。
COVID-19 hospitalisations per active case were observed to have increased by 113 % and 36.8 % respectively.
アクティブなケースあたりのCOVID-19による入院は、それぞれ113%と36.8%増加したことが観察されました。
While the SA SARS-CoV-2 lineage cluster 3 (predominantly the Delta (B.1.617.2) SARS-CoV-2 VOC) was also observed to have resulted in an increased COVID-19 hospitalisation relative to the SA SARS-CoV-2 lineage cluster 1.
SA SARS-CoV-2系統クラスター3(主にデルタ(B.1.617.2)SARS-CoV-2 VOC)でも、SASARS-CoV-2系統クラスター1と比較してCOVID-19入院が増加していることが観察されました。
The COVID-19 hospitalisations per active case increased by 55.8 %.
アクティブなケースあたりのCOVID-19入院は、55.8%増加しました。
SA SARS-CoV-2 lineage clusters 1, 2 and 3 resulted in a similar distribution of the COVID-19 hospital admission status profile in South African hospitals.
SA SARS-CoV-2系統クラスター1、2、および3は、南アフリカの病院におけるCOVID-19入院状態プロファイルの同様の分布をもたらしました。
Most COVID-19 hospitalised cases in South Africa were hospitalised in the general ward (72.8-78.7 %).
南アフリカでのCOVID-19の入院症例のほとんどは、一般病棟に入院していました(72.8〜78.7%)。
COVID-19 patients on oxygen were the second-largest hospital admission status (16.8-27.6 %) in South Africa followed by the COVID-19 patients in the intensive care unit (14.1-16.7 %).
酸素を使用しているCOVID-19患者は、南アフリカで2番目に大きい入院状態(16.8-27.6%)であり、集中治療室のCOVID-19患者(14.1-16.7%)がそれに続きました。
SA SARS-CoV-2 lineage clusters 1 and 3 resulted in the same COVID-19 patients admitted to the intensive care unit.
SA SARS-CoV-2系統クラスター1および3の結果、同じCOVID-19患者が集中治療室に入院しました。
While the SA SARS-CoV-2 lineage cluster 2 resulted in higher COVID-19 patients on oxygen than the SA SARS-CoV-2 lineage clusters 1 and 3.
SA SARS-CoV-2系統クラスター2は、SA SARS-CoV-2系統クラスター1および3よりも酸素摂取量の多いCOVID-19患者をもたらしました。
This result highlightsthe increased COVID-19 severity due to the Beta SARS-CoV-2 VOC.
この結果は、ベータSARS-CoV-2VOCによるCOVID-19の重症度の増加を浮き彫りにしています。
The SA SARS-CoV-2 lineage clusters 1, 2 and 3 resulted in different distributions of the COVID-19 hospital admission age profile.
SA SARS-CoV-2系統クラスター1、2、および3は、COVID-19入院年齢プロファイルの異なる分布をもたらしました。
Most COVID-19 hospitalised cases in South Africa were in the ages of 50 to 69 years.
南アフリカでのCOVID-19の入院症例のほとんどは、50〜69歳でした。
COVID-19 patients in the age groups of 40 to 49 years were the second-largest hospital admitted age group in South Africa.
40〜49歳の年齢層のCOVID-19患者は、南アフリカで2番目に大きな入院年齢層でした。
COVID-19 admitted patients in the age groups of 0 to 19 years were relatively low (1.8 to 4.4 %) and highest in the second COVID-19 epidemic wave period.
COVID-19に入院した0〜19歳の患者は、比較的低く(1.8〜4.4%)、2回目のCOVID-19流行の波の期間で最も高かった。
The SA SARS-CoV-2 lineage cluster 3 (predominantly the Delta (B.1.617.2) SARS-COV-2 VOC) resulted in an increased incidence in COVID-19 patients in the age groups over 70 years compared to the SA SARS-CoV-2 lineage clusters 1 and 2.
SA SARS-CoV-2系統クラスター3(主にデルタ(B.1.617.2)SARS-COV-2 VOC)は、SA SARS-CoV-2系統クラスター1および2と比較して、70歳以上の年齢層のCOVID-19患者の発生率を増加させました。
The SA SARS-CoV-2 lineage clusters 1, 2 and 3 resulted in a similar distribution of the COVID-19 hospitalised death age profile.
SA SARS-CoV-2系統クラスター1、2、および3は、COVID-19入院死亡年齢プロファイルの同様の分布をもたらしました。
Most COVID-19 hospitalised deaths in South Africa in the first, second and third COVID-19 epidemic wave period were in the ages of 50 to 69 years.
南アフリカでの第1、第2、第3のCOVID-19流行波期間における、ほとんどのCOVID-19入院死者は、50〜69歳でした。
COVID-19 hospitalised deaths in the age groups of 0 to 29 years in South Africa were relatively low (0.194 to 1.97 %).
南アフリカの0〜29歳の年齢層でのCOVID-19による入院死亡は比較的少なかった(0.194〜1.97%)。
The cumulative risk of death in COVID-19 hospitalised deaths increased with increasing age group groups with age groups of 50 to 69 years having the highest risk.
COVID-19で入院した死亡の累積死亡リスクは、50〜69歳の年齢層が最もリスクが高い年齢層グループの増加とともに増加しました。
The SA SARS-CoV-2 lineage cluster 2 (predominantly the Beta (B.1.351) SARS-CoV-2 VOC) resulted in an increase in the incidence of hospitalised deaths in age groups of 50 to 59 compared to the SARS-CoV-2 lineage clusters 1 and 3.
SA SARS-CoV-2系統クラスター2(主にベータ(B.1.351)SARS-CoV-2 VOC)は、SARS-CoV-2系統クラスター1および3と比較して、50〜59歳の年齢層で入院死亡の発生率を増加させました。
The mean COVID-19 hospital case fatality rate in South Africa’s first, second and third COVID-19 epidemic wave periods were 2.06±1.10 %, 2.29±1.60 % and 2.08±1.16 % respectively.
南アフリカの第1、第2、第3のCOVID-19流行波期間における平均COVID-19致死率は、それぞれ2.06±1.10%、2.29±1.60%、2.08±1.16%でした。
The number of excess natural deaths not accounted for in the COVID-19 reported deaths were the same as the COVID-19 reported deaths in the first COVID-19 epidemic wave period and twice the COVID-19 reported deaths in the second and third COVID-19 epidemic wave period.
COVID-19で報告された死亡数に含まれていない過剰な自然死亡数は、COVID-19で報告された最初のCOVID-19流行波期間での死亡数と同じ、COVID-19で報告された2番目と3番目のCOVID流行波期間での死亡数の2倍でした。
The SA SARS-CoV-2 lineage clusters 1, 2 and 3 resulted in similar COVID-19 hospital case-fatality rates in South Africa.
SA SARS-CoV-2系統クラスター1、2、および3は、南アフリカで同様のCOVID-19病院の致死率をもたらしました。
While the SA SARS-CoV-2 lineages clusters 2 and 3 resulted in similar COVID-19 discharge rates, excess natural deaths, weekly reported COVID-19 deaths and ECDR in South Africa.
SA SARS-CoV-2系統クラスター2と3は、南アフリカで同様のCOVID-19排出率、過剰な自然死、毎週報告されたCOVID-19死、ECDRをもたらしました。
The SA SARS-CoV-2 lineage cluster 1 (predominantly the B.1.1.54, B.1.1.56 C.1 SARS-CoV-2 lineages) resulted in statistically different excess natural deaths, weekly reported COVID-19 deaths and ECDR in South Africa relative to the aforementioned SARS-CoV-2 clusters.
SA SARS-CoV-2系統クラスター1(主にB.1.1.54、B.1.1.56 C.1 SARS-CoV-2系統)は、前述のSARS-CoV-2クラスターと比較して、南アフリカで統計的に異なる過剰な自然死、毎週報告されたCOVID-19死、およびECDRをもたらしました。
This study shows that the evolution of SARS-CoV-2 resulted in an increase in COVID-19 transmissibility and severity in South Africa.
この研究は、SARS-CoV-2の進化により、南アフリカでCOVID-19の感染率と重症度が増加したことを示しています。
The Delta SARS-CoV-2 VOC resulted in increased COVID-19 transmissibility in the South African population while both the Beta SARS-CoV-2 VOC and Delta SARS-CoV-2 VOC resulted in more severe COVID-19 than the initial SARS-CoV-2 lineages detected in South Africa’s first epidemic wave period.
SARS-CoV-2デルタ株により、南アフリカの人口のCOVID-19感染率が増加しました。一方、SARS-CoV-2VOCベータ株とSARS-CoV-2デルタ株はどちらも、南アフリカの最初の流行の波の期間に検出された最初のSARS-CoV-2系統よりも深刻なCOVID-19をもたらしました。
以下省略。
この記事が気に入ったらサポートをしてみませんか?