続・O-map風ウェブ地図作成 20240705
続きです。
ここまでの成果デモ。
「Run Pen」をクリック(タップ)して、あちこち移動して縮小したり拡大してみたりしてください。ズームレベルを保ったまま表示範囲を広げたい場合は「0.5x」、「0.25x」をクリック。
今回やったこと
機能追加
現在地に移動する機能を追加
スケール表示を追加
地図のエクスポート機能を追加
地物を追加・変更
線路を地理院ベクトルタイルからOpenStreetMapに変更
ズームレベル4-7の海岸線の表示を追加
砂地を追加
岩石地を追加
道幅を変更
桟橋を追加
滑走路を追加
機能追加
現在地に移動する機能を追加
以下の行を追加しました。
参考: https://maplibre.org/maplibre-gl-js/docs/API/type-aliases/GeolocateControlOptions/
  map.addControl(new maplibregl.GeolocateControl({
    trackUserLocation: false,
    showUserLocation: false
  }), 'top-right');
自分の周囲の範囲の地図に移動してくれればよくて、現在地を示すポイントの表示は邪魔なのでオフにしました。
スケール表示を追加
以下の行を追加しました。
参考: https://maplibre.org/maplibre-gl-js/docs/API/classes/ScaleControl/
  map.addControl(new maplibregl.ScaleControl({
    maxWidth: 80,
    unit: 'metric'
  }));
オプションはスケールの幅の指定と、単位をメートル(他の選択肢はフィート、海里)に設定しました。
地図のエクスポート機能を追加
プラグインのWebサイト (https://maplibre-gl-export.water-gis.com/)のUsageに書いてある行をそのまま既存のソースに追加したら簡単にプラグインを追加できました。
			<link href="https://cdn.jsdelivr.net/npm/@watergis/maplibre-gl-export@3.8.1/dist/maplibre-gl-export.css" rel="stylesheet" />
<script src="https://cdn.jsdelivr.net/npm/@watergis/maplibre-gl-export@3.8.1/dist/maplibre-gl-export.umd.js"></script> map.addControl(new MaplibreExportControl.MaplibreExportControl({
PageSize: MaplibreExportControl.Size.A4,
PageOrientation: MaplibreExportControl.PageOrientation.Landscape,
Format: MaplibreExportControl.Format.PNG,
DPI: MaplibreExportControl.DPI[300],
Crosshair: true,
PrintableArea: true,
Local: 'ja'
}), 'top-right');出力された画像に位置情報が埋め込まれていることを期待していたのですが、それは無いようでした。また、追加したスケールも画像に含まれないようです。
地物を追加・変更
線路を地理院ベクトルタイルからOpenStreetMapに変更
地下(トンネル)部分の除外、リフトの除外のための条件指定をシンプルにできるので変更しました。
地下(トンネル)部分の除外
地理院ベクトルタイルの場合
ズームレベル8〜13のとき、「railState」属性「100」がトンネル、「300」が地下。
ズームレベル14〜16のとき、「railState」属性「2」がトンネル、「3」が地下。
OpenStreetMap(OpenMapTiles)の場合
トンネルも地下鉄の地下部分も同じく「brunnel」キーが「tunnel」。
リフトの除外
地理院ベクトルタイルの場合
ズームレベル11〜13のとき、「rtCode1」属性の上5桁が40206が索道。
ズームレベル14〜16のとき、「rtCode」属性の上5桁が40206が索道。
OpenStreetMap(OpenMapTiles)の場合
鉄道の「railway」キーと索道の「aerialway」キーでそもそも別。
こんな感じになりました。
        {
          "id": "509-線路-黒部分-osm",
          "type": "line",
          "source": "openmaptiles",
          "source-layer": "transportation",
          "filter": [
            "all",
            ["==", "class", "rail"],
            ["!=", "brunnel", "tunnel"]
          ],
          "layout": {
            "line-join": "miter",
            "line-cap": "butt"
          },
          "paint": {
            "line-color": "#000000",
            "line-width": 1.4
          }
        },
        {
          "id": "509-線路-白部分-osm",
          "type": "line",
          "source": "openmaptiles",
          "source-layer": "transportation",
          "filter": [
            "all",
            ["==", "class", "rail"],
            ["!=", "brunnel", "tunnel"]
          ],
          "layout": {
            "line-join": "miter",
            "line-cap": "butt"
          },
          "paint": {
            "line-color": "#ffffff",
            "line-width": 1.0,
            "line-dasharray": [4, 6]
          }
        },
ズームレベル4-7の海岸線の表示を追加
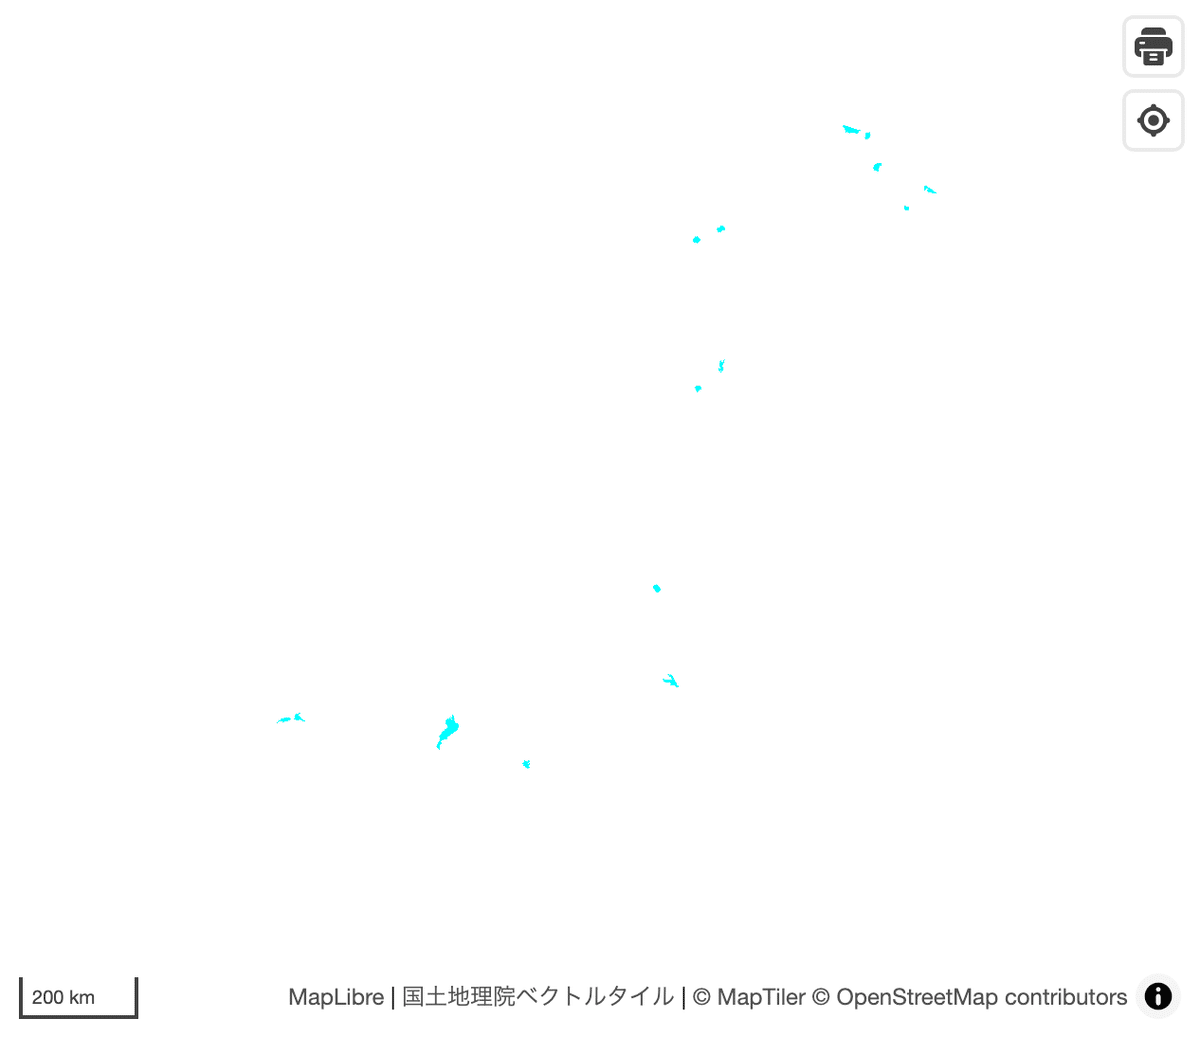
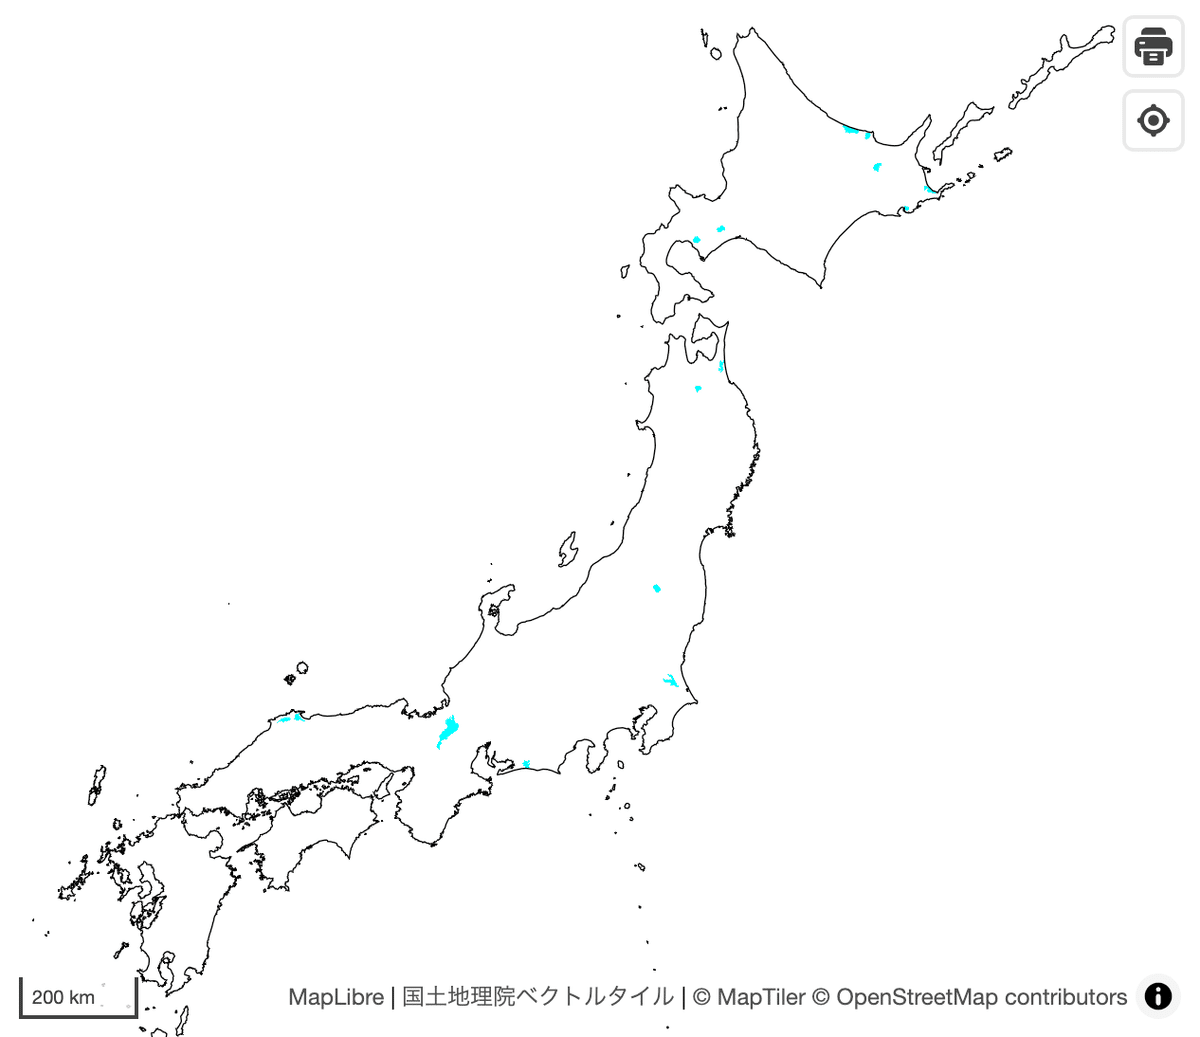
ズームレベルによって海岸線のftCodeが異なっていて、ズームレベル4-7のとき海岸線が表示されなくなっていたのを改善しました。
before
after
砂地を追加
こんな感じで追加しました。
  const sandyGroundSVG =
    `
    <svg xmlns="http://www.w3.org/2000/svg" width="6" height="6" viewBox="0 0 6 6">
      <rect width="100%" height="100%" fill="#ffdd9a"/>
      <circle cx="4" cy="4" r="0.7" fill="#000000" />
      <circle cx="1" cy="1" r="0.7" fill="#000000"/>
    </svg>
   `;

  const sandyGroundImage = new Image();
  sandyGroundImage.src = 'data:image/svg+xml;charset=utf-8,' + encodeURIComponent(sandyGroundSVG);
  sandyGroundImage.onload = () => {
    map.addImage('sandyGroundPattern', sandyGroundImage);
  };
{
"id": "213-砂地-osm",
"type": "fill",
"minzoom": 12,
"source": "openmaptiles",
"source-layer": "landcover",
"filter": ["in", "class", "sand"],
"paint": {
"fill-pattern": "sandyGroundPattern"
}
},岩石地を追加
こんな感じで追加しました。
  const boulderFieldSVG =
    `
    <svg width="18.5" height="18.5" xmlns="http://www.w3.org/2000/svg">
      <rect width="100%" height="100%" fill="white"/>
      <polygon points="2.760,16.200 5.580,15.120 3.480,16.910" fill="black"/ />
      <polygon points="15.900,12.000 12.780,12.060 16.200,8.700" fill="black" />
      <polygon points="11.820,3.120 8.880,2.340 13.080,0.000" fill="black" />
      <polygon points="9.000,15.600 10.380,12.780 11.820,17.460" fill="black" />
      <polygon points="16.020,15.120 18.240,12.900 18.120,17.760" fill="black" />
      <polygon points="3.300,9.240 4.440,12.120 0.000,10.080" fill="black" />
      <polygon points="3.660,4.440 6.300,2.700 5.160,7.440" fill="black" />
      <polygon points="9.360,8.880 11.580,6.660 11.460,11.520" fill="black" />
      <polygon points="14.580,3.960 16.260,1.320 17.160,6.120" fill="black" />
    </svg>
    `;

  const boulderFieldImage = new Image();
  boulderFieldImage.src = 'data:image/svg+xml;charset=utf-8,' + encodeURIComponent(boulderFieldSVG);
  boulderFieldImage.onload = () => {
    map.addImage('boulderFieldPattern', boulderFieldImage);
  };
{
"id": "208-岩石地-osm",
"type": "fill",
"minzoom": 11,
"source": "openmaptiles",
"source-layer": "landcover",
"filter": [
"all",
["in", "class", "rock"],
["in", "subclass", "scree"]
],
"paint": {
"fill-pattern": "boulderFieldPattern"
}
},道幅を変更
地理院Vectorを参考に、ズームレベルに合わせて道幅を変更するようにしました。↓の書き方で、ズームレベル15のとき道幅3ピクセル、ズームレベル17のとき道幅21ピクセルで、そのあいだのズームレベルでズームレベルを変更するとなめらかに道幅が増減します。
            "line-width": {
              "stops": [
                [
                  15,
                  3
                ],
                [
                  17,
                  21
                ]
              ]
            }
          }
桟橋を追加
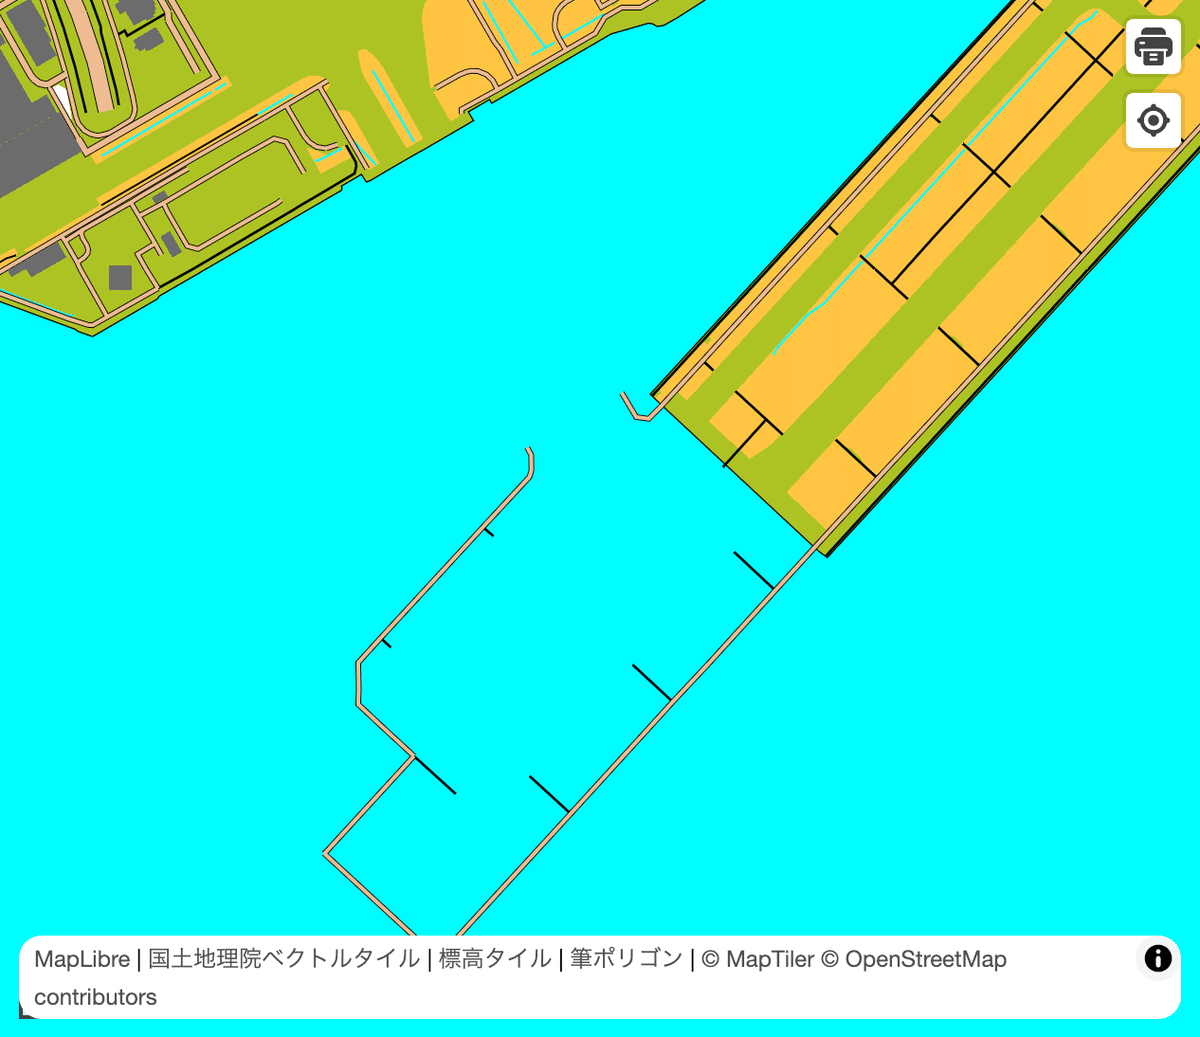
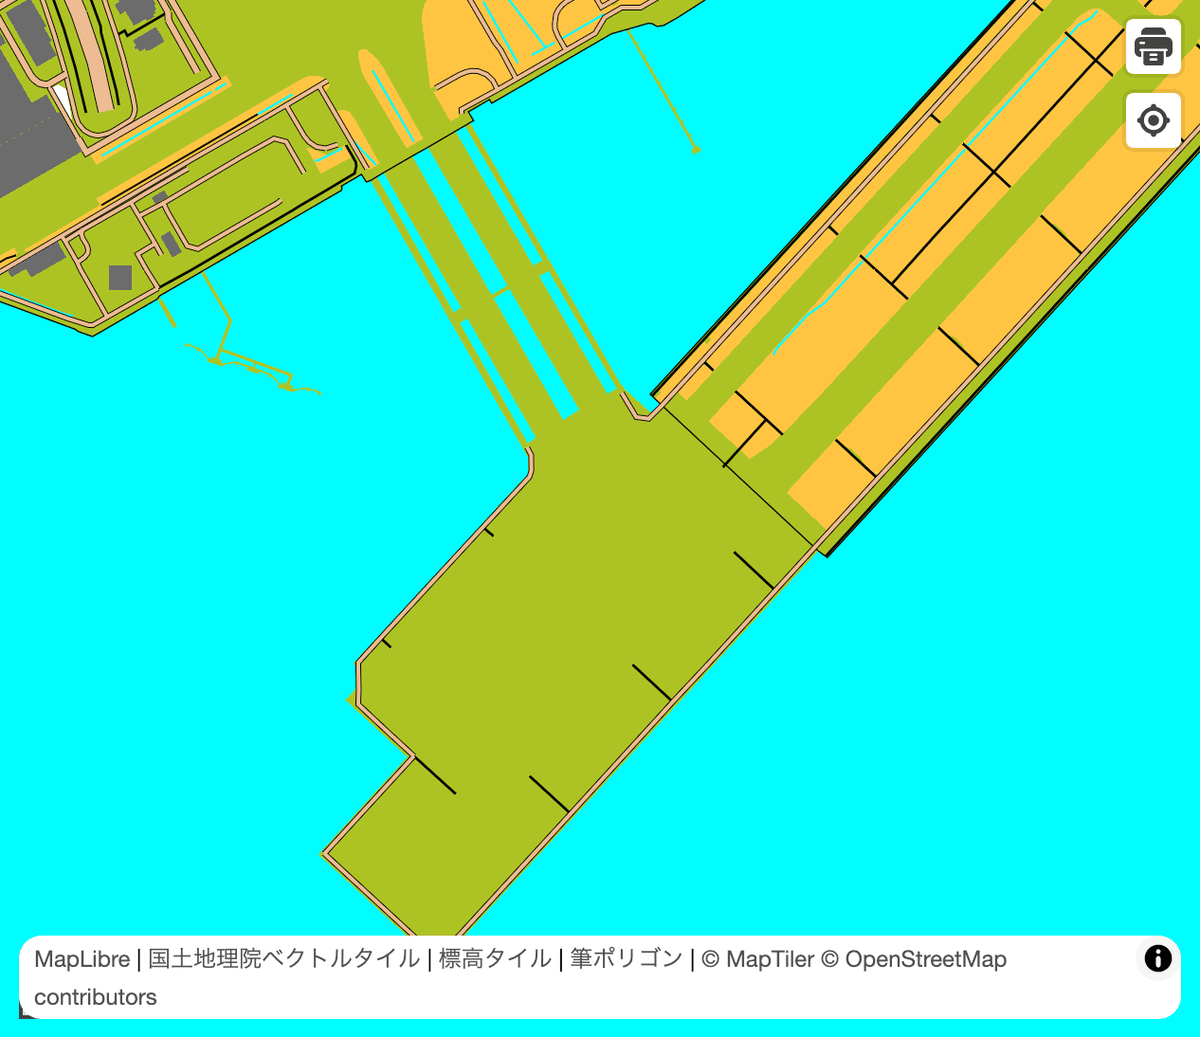
国土地理院ベクトルタイルで、空港のところが島ではなく水域の上に桟橋で表現されていて、それを無視しておかしいことになっていたので桟橋を描画するようにして修正しました。
before
after
        {
          "id": "構造物-桟橋-gsivt",
          "type": "fill",
          "source": "gsivt",
          "source-layer": "wstructurea",
          "filter": ["any", ["==", "ftCode", 5411]],
          "paint": {
            "fill-color": "#9eba1d"
          }
        },
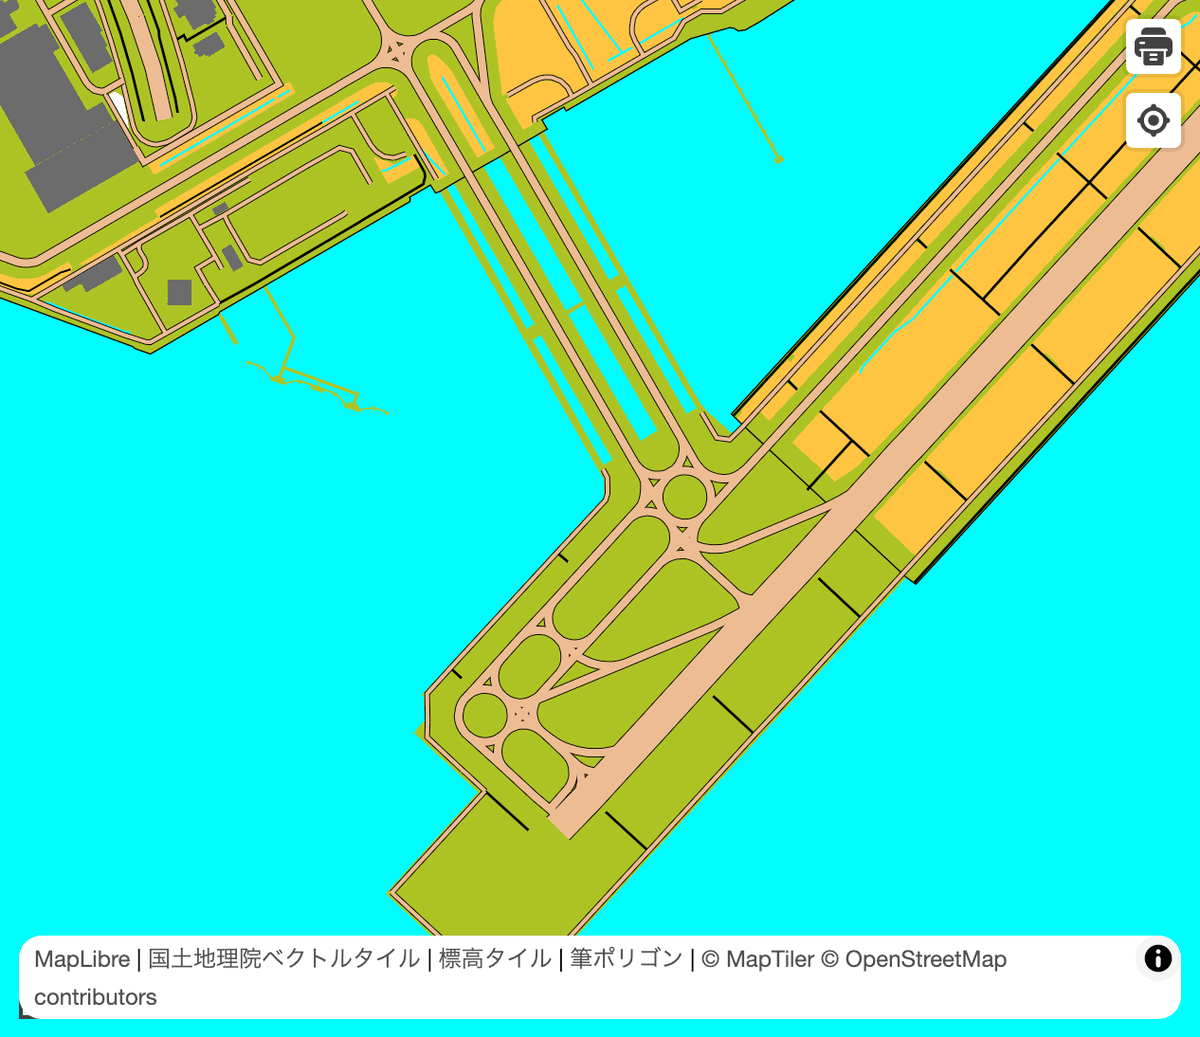
滑走路を追加
ついでに空港内の滑走路とタクシーウェイは国土地理院ベクトルタイルに含まれないようなので、OpenStreetMapから拾って載せてみました。
            {
              "id": "空港-タクシーウェイ-osm",
              "type": "line",
              "source": "openmaptiles",
              "source-layer": "aeroway",
              "filter": [
                "all", ["==", "class", "taxiway"],
              ],
              "layout": {
                "line-join": "miter"
              },
              "paint": {
                "line-color": "#e8ae80",
                "line-width": {
                  "stops": [
                    [
                      15,
                      4
                    ],
                    [
                      17,
                      21
                    ]
                  ]
                }
              }
            },
            {
              "id": "滑走路-枠線-osm",
              "type": "line",
              "source": "openmaptiles",
              "source-layer": "aeroway",
              "filter": [
                "all", ["==", "class", "runway"],
              ],
              "layout": {
                "line-join": "miter"
              },
              "paint": {
                "line-width": {
                  "stops": [
                    [
                      11,
                      2
                    ],
                    [
                      13,
                      9
                    ],
                    [
                      15,
                      24
                    ],
                    [
                      17,
                      26
                    ]
                  ]
                }
              }
            },
            {
              "id": "滑走路-osm",
              "type": "line",
              "source": "openmaptiles",
              "source-layer": "aeroway",
              "filter": [
                "all", ["==", "class", "runway"],
              ],
              "layout": {
                "line-join": "miter"
              },
              "paint": {
                "line-color": "#e8ae80",
                "line-width": {
                  "stops": [
                    [
                      11,
                      1
                    ],
                    [
                      13,
                      8
                    ],
                    [
                      15,
                      23
                    ],
                    [
                      17,
                      25
                    ]
                  ]
                }
              }
            },