3回ワクチン接種者が「エイズ」を発症し、ワクチン未接種者よりもコビッド-19で死亡する確率が5.1倍高くなったというカナダ政府のデータが実に恐ろしい

3回ワクチン接種者が「エイズ」を発症し、ワクチン未接種者よりもコビッド-19で死亡する確率が5.1倍高くなったというカナダ政府のデータが実に恐ろしい
BY THE EXPOSÉ
2023年10月1日
カナダ政府が発表したコビッド19の最新の公式数値は実に恐ろしいものである。この数字によると、カナダ全土の2回ワクチン接種者は平均74%、3回ワクチン接種者は平均73%の免疫系能力を失っている。
そのため、2回ワクチン接種者はワクチン未接種者に比べ、コビッド19に感染する確率が平均3.8倍、コビッド19で死亡する確率が平均3.3倍高いという数字が出ている。
しかし、3回接種者の死亡リスクはさらに悪い。公式の数字によれば、彼らはワクチン未接種者に比べ、コビッド19に感染する確率は平均3.7倍、コビッド19で死亡する確率は5.1倍である。
従って、これらの数字は、カナダの2回ワクチン接種者と3回ワクチン接種者の両方が、コビッド-19の注射によって免疫系に大きなダメージを受け、後天性免疫不全症候群を発症していることを示唆している。
カナダのCovid-19の数字は、カナダ政府が発表したものである(こちらを参照)。
その最新データはこちらからPDFでダウンロード可能である。
カナダ政府は、カナダが「ワクチン未接種のパンデミック」を経験しているように見せかけ、Covid-19ワクチンが明らかに有効であるかのように、公式Covid-19データを公表している。しかし、このデータは詐欺である。
ダウンロード可能なPDFの20ページ以降には、20年12月14日のカナダでのコビッド19ワクチン接種キャンペーン開始から22年2月27日までのコビッド19の症例、入院、死亡に関するデータが含まれている。
なぜなら、カナダのわずか0.3%が完全にワクチン接種を受けたとみなされた2021年1月に、Covid-19の症例、入院、死亡が急増したからである。
しかし、「WayBackMachine」のおかげで、カナダ政府の過去の「Covid-19 Daily Epidemiology Update」報告書を見て、これらの死亡、入院、症例の大部分を実際に占めているのは誰なのかを推測することができる。
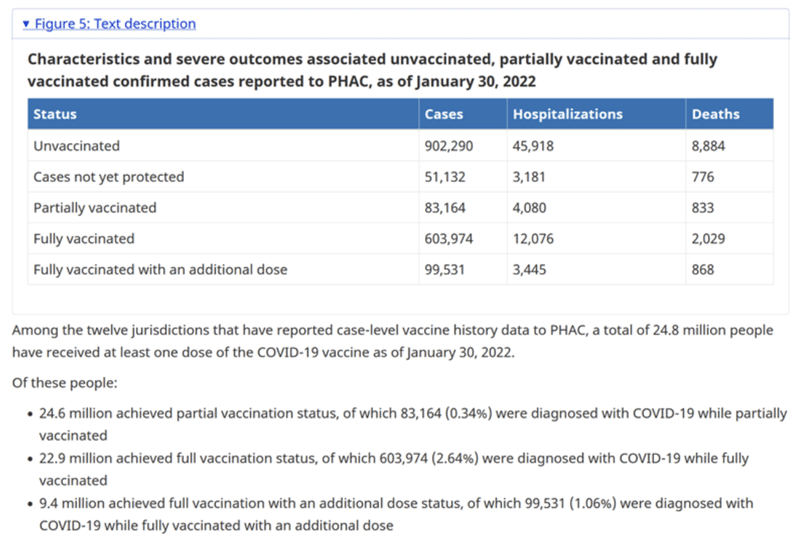
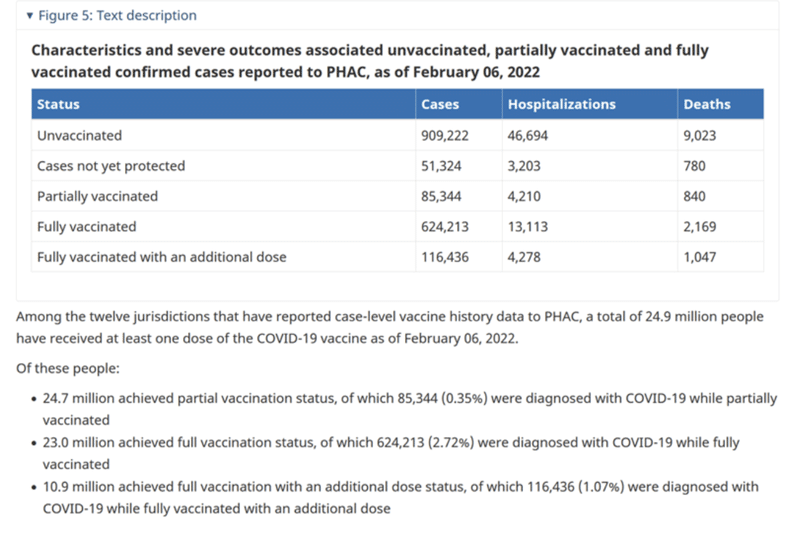
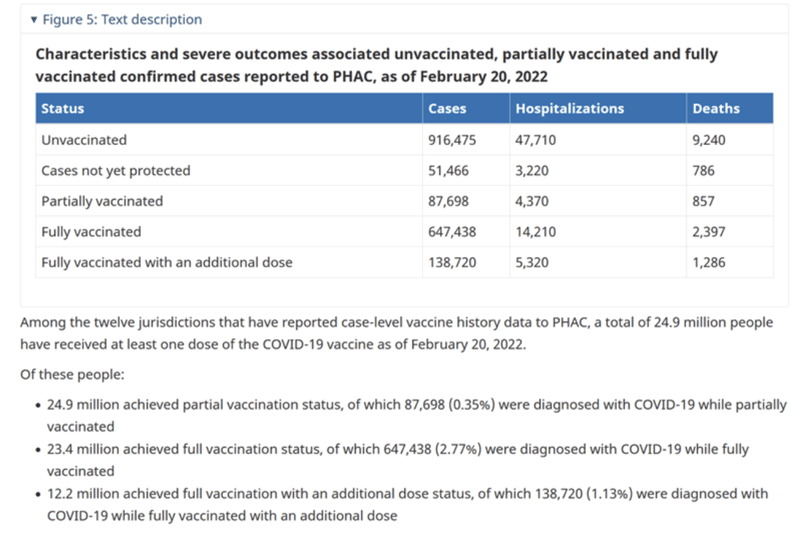
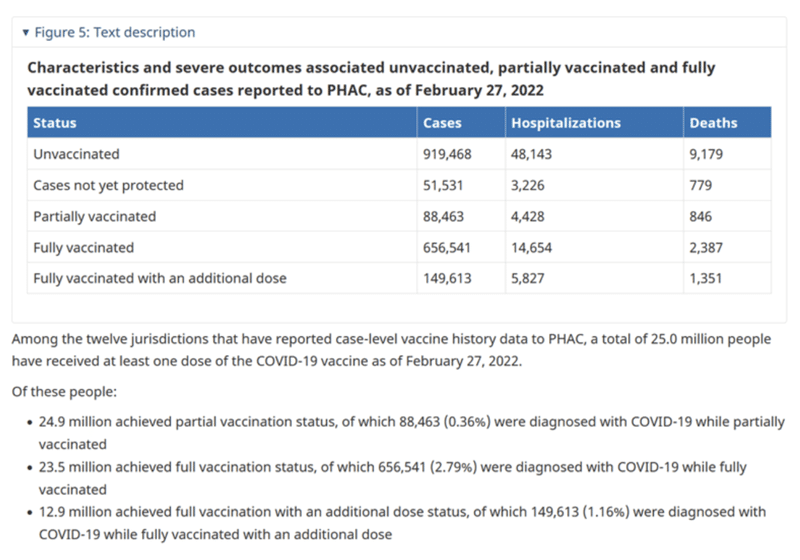
以下は、1月30日、2月6日、2月13日、2月20日、2月27日にカナダ政府が発表した「Covid-19 Daily Epidemiology Update」の表で、2020年12月14日時点のワクチン接種状況別の症例数、入院数、死亡数を示している。また、各レポートの時点での各ワクチングループの総人口数も示しているー

あとは単純な引き算をして、いつ誰がCovid-19感染者の大半を占めたかを推理するだけである。以下のグラフは、22年1月31日から22年2月27日までの間にカナダ全土で発生したCovid-19感染者数を、ワクチン接種状況別に示したものである。
ご覧のように、ワクチン未接種者が最も少ない症例数を毎週占めており、2月6日に終わる週の6,932例から2月27日に終わる週の2,993例まで、週ごとに減少している。
一方、2回接種者と3回接種者の感染者数は天文学的に増加しているが、2月27日までの週を除き、前週比で減少している。
しかし、ワクチン未接種の人口がこれほど少ないのであれば、「これは予想されたことだ!」と言う声が聞こえてきそうだ。しかし、残念ながらそれは間違っている。
カナダの人口は約3,801万人である。

そこで、カナダ政府から提供された上記の表の数字に基づき、22年1月31日から2月27日までの各週のカナダ全土におけるワクチン接種状況別の人口規模を示したグラフを以下に示す。
ワクチン未接種の人口数は、全体の人口数3,801万人から、カナダでコビッド19ワクチンを少なくとも1回接種した人の人口数を単純に差し引いたものである。2回接種人口とは、カナダで2回以上コビッド-19ワクチンを接種した人口から3回接種人口を差し引いたものである。
2月6日終了週の1,331万人から2月27日終了週の1,311万人へと減少したのに対し、3回接種者は2月6日終了週の1,090万人から2月27日終了週の1,290万人へと増加している。
では一体なぜ、2回ワクチンと3回ワクチン接種者の間で感染者が増えているのだろうか?
a) ワクチン未接種者より人口が少ないから?
b)コビッド19に感染するリスクを減らすと言われているワクチンを接種している。
答えは明白だ。Covid-19ワクチンが免疫系にダメージを与え、被接種者がCovid-19に感染しやすくなるからだ。
以下のグラフは、1月31日から2月27日までの1週間における、カナダ全土のワクチン接種状況別の10万人当たりのCovid-19感染率を示している。
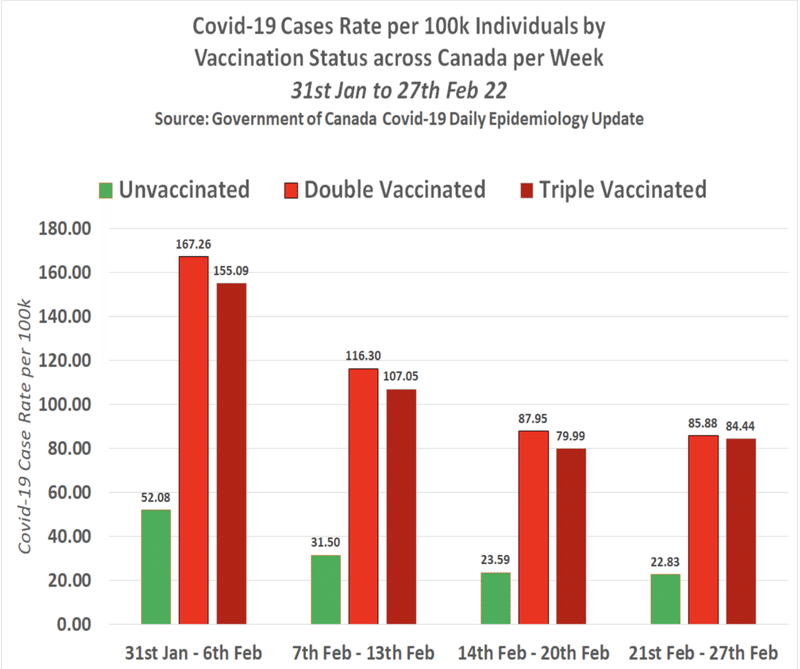
症例発生率は、まず各ワクチン群の総人口を10万人で割って算出される。次に各ワクチン群における症例数を前式の答えで割って症例率を算出する。
例
1,331万人÷10万人=133.1
6,932例/133.1=10万人あたり52.08例
このように、少なくとも22年1月31日以降、2回接種者と3回接種者における感染率は天文学的に高くなっている。症例率がわかったので、ファイザー社のワクチン効果計算式を使って、2回接種者と3回接種者の両方におけるCovid-19ワクチンの効果を計算することができる。
その計算式は
ワクチン未接種症例率-ワクチン接種症例率÷ワクチン未接種症例率×100=ワクチン有効率
以下のグラフは、上記の症例率に基づき、2回ワクチン接種者と3回ワクチン接種者における、カナダ全土での実際のCovid-19ワクチンの有効性を示しています。
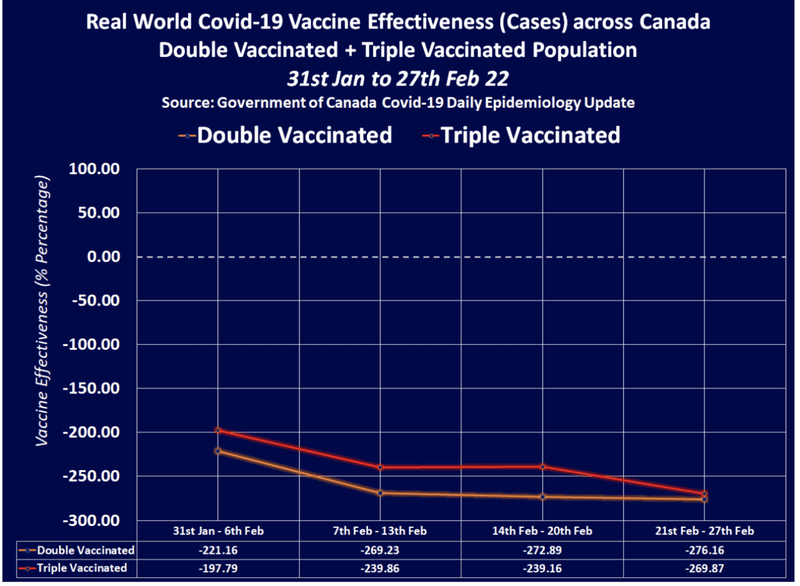
2月6日に終わる週では、2回接種者のワクチン有効率はマイナス221.16%であった。しかし、2月27日に終わる週には、マイナス276.16%とさらに低下した。
しかし、3回ワクチン接種者では、わずかに良好であったものの、さらに急減している。2月6日に終わる週でも、3回ワクチン接種者のワクチン接種率はマイナス197.79%であった。しかし、2月27日に終わる週には、マイナス269.87%まで低下した。
これは平均すると、2回接種者は未接種者の3.8倍、3回接種者は未接種者の3.7倍、コビッド19に感染しやすいことを意味する。
しかし、ワクチンの有効性とは、ワクチンの効果ではなく、ワクチン接種者の免疫システムのパフォーマンスを、ワクチン未接種者の免疫システムのパフォーマンスと比較したものである。
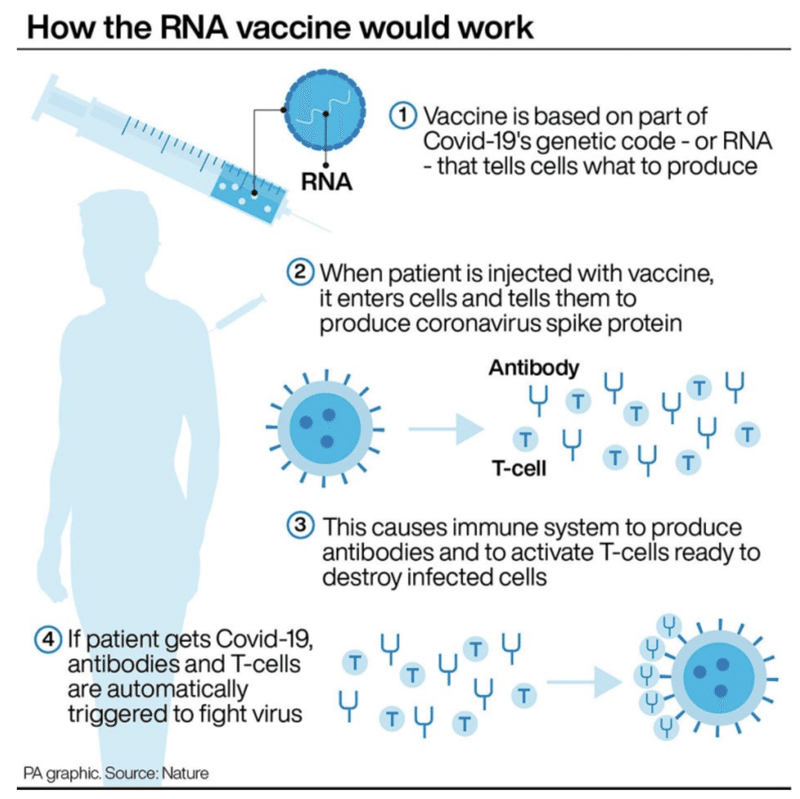
Covid-19ワクチンは、Covid-19ウイルスのオリジナル株のスパイク・タンパク質を認識するように免疫系を訓練することになっている。これは、あなたの細胞にスパイク・タンパク質を産生するよう指示し、あなたの免疫系が抗体を産生し、後で再びCovid-19ウイルスのスパイク部分に遭遇した場合にそれを使用するよう記憶することによって行われる。
しかし、ワクチンは最初の訓練を終えた後、ぶらぶらすることはない。つまり、当局が「ワクチンの効果は時間とともに弱まる」と述べているのは、「免疫システムの性能が時間とともに弱まる」というのが本当の意味なのだ。
ここで問題になっているのは、免疫システムが本来の自然な状態に戻っていないということだ。もしそうであれば、Covid-19に感染した場合の結果は、ワクチンを接種していない人の結果と同じになるはずである。
その代わりに、ワクチン未接種集団の方がより優れた免疫系を持っていることを意味する速度で減少し続けているのであり、これはコビッド-19の注射が完全接種者の免疫系を破壊していることを意味する。
以下のグラフは、カナダ全土における2回ワクチン接種者と3回ワクチン接種者の免疫システムの性能と、ワクチン未接種者の自然免疫システムの性能を比較したものである。
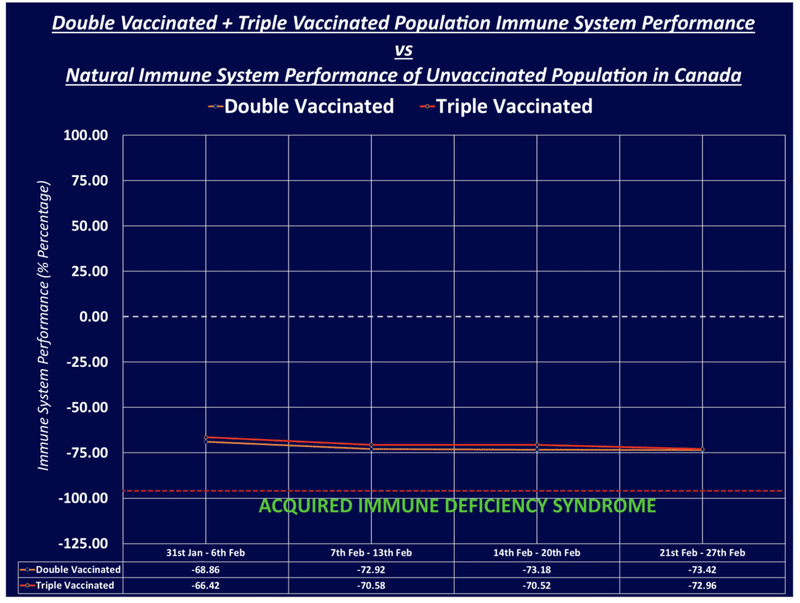
免疫システムの性能は、ワクチンの有効性を等しくするために使用されるものとは少し異なる計算を用いて算出されており、それは以下の通りである。
ワクチン未接種者の罹患率-ワクチン接種者の罹患率/ワクチン未接種者の罹患率またはワクチン接種者の罹患率のどちらか大きい方×100=免疫システムのパフォーマンス%。
例
2月21日~2月27日の3回ワクチン接種率 = 22.83 - 84.44 / 84.44 x 100 = -72.96
この数字から、平均的な2回ワクチンを接種したカナダ人は、免疫システムの能力の73.42%を失っていることがわかる。つまり、ある種のウイルスやある種の癌などと闘うための免疫システムの最後の26.58%まで低下していることになる。
しかし残念ながら、3回目の予防接種を受けても状況は改善されない。この数字によると、平均的な3回接種を受けたカナダ人は、免疫システムの能力の72.96%を失っており、特定のクラスのウイルスや特定の癌などと闘う免疫システムの最後の27.04%まで低下していることになる。
しかし、カナダ政府が発表した数字は年齢層別ではなく、全人口の総合的な数字である。そして、ご存知のように、ワクチンの効果(免疫システムの性能)は、週ごとに低下している。
したがって、最初にワクチンを接種した人たちは、2回目や3回目の接種を受けたばかりの人たちよりもはるかに深刻な免疫システムの劣化に苦しんでいると考えるのは、まったくもっともなことである。 そして、以下の死亡に関する公式の数字に基づき、私たちは、2回、3回のワクチン接種を受けたカナダ人の多くが、マイナス90%からマイナス100%の免疫システム性能の壁を超えた、つまり、実質的にコヴィド-19ワクチン誘発後天性免疫不全症候群の新型を発症したことを提案する。
以下のグラフは、22年1月31日から22年2月27日までの間にカナダ全土で発生したワクチン接種状況別のコビッド19による死亡者数を週ごとに示したものである。
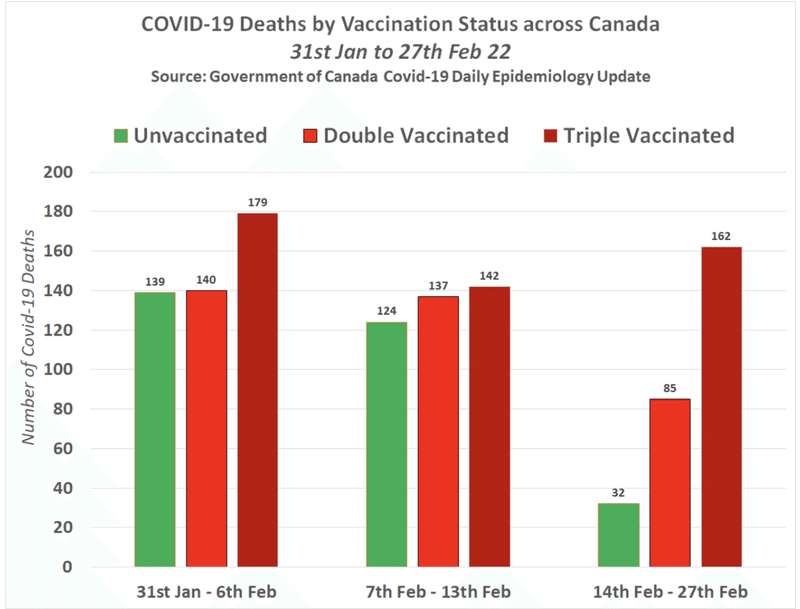
2月27日の報告では、2月20日の報告よりもすべてのワクチン接種群で死亡数が減少している。そこで、2月14日の報告書と2月27日の報告書の間の死亡者数を推計した。
ご覧のように、2回接種と3回接種の両方で死亡例がはるかに多いことがわかるが、最後の2週間には特に注意が必要である。
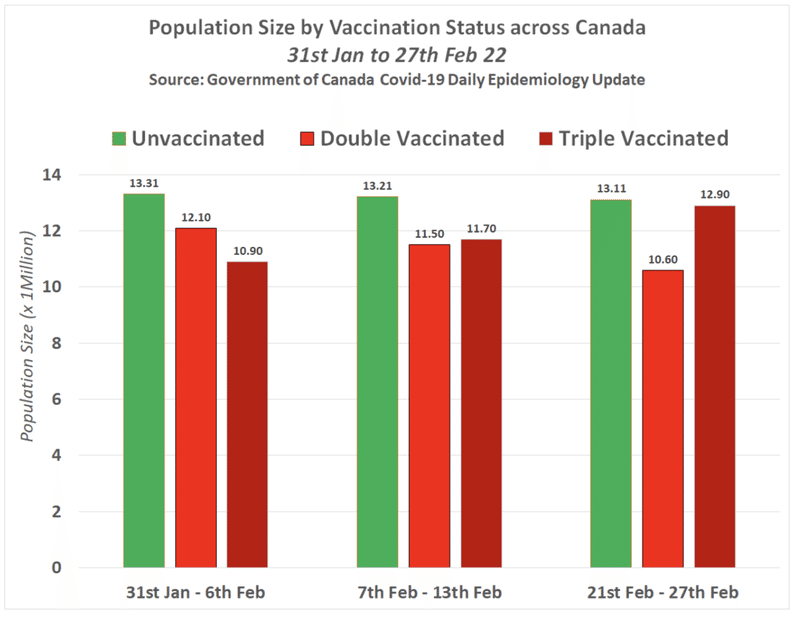
以下のグラフは、1月31日から2月27日までのカナダ全土におけるワクチン接種状況別の人口規模を示している。
次のグラフは、上記の死亡数と人口規模に基づき、1月31日から2月27日までの1週間ごとのカナダ全土におけるワクチン接種状況別の10万人当たりのCovid-19による死亡率を示したものである。
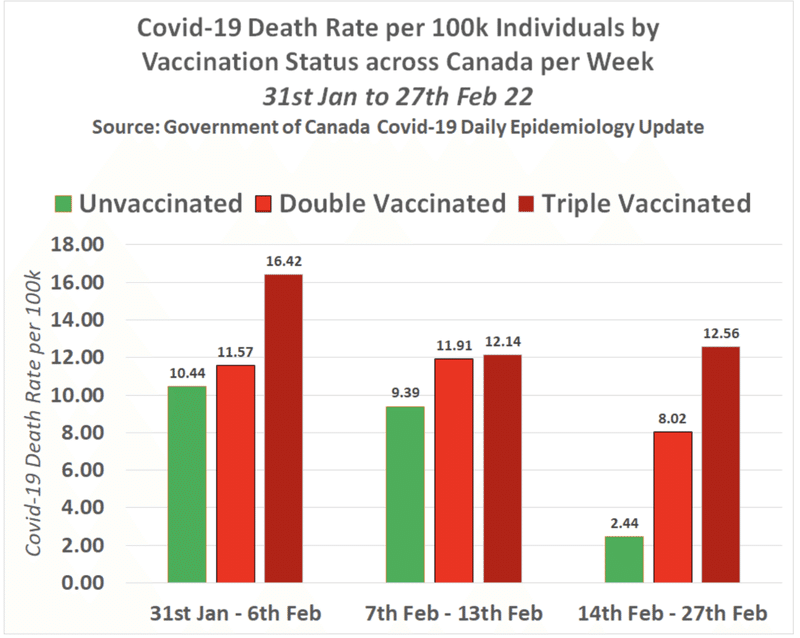
ご覧のように、少なくとも22年1月31日以降、ワクチン未接種者の死亡率が最も低く、3回ワクチン接種者の死亡率が最も高くなっている。しかし、2月14日から2月27日にかけての死亡率には深い問題がある。
次のグラフは、上記の死亡率に基づき、2回接種者と3回接種者における、カナダ全土での死亡に対する実際のCovid-19ワクチンの有効性を示したものである。
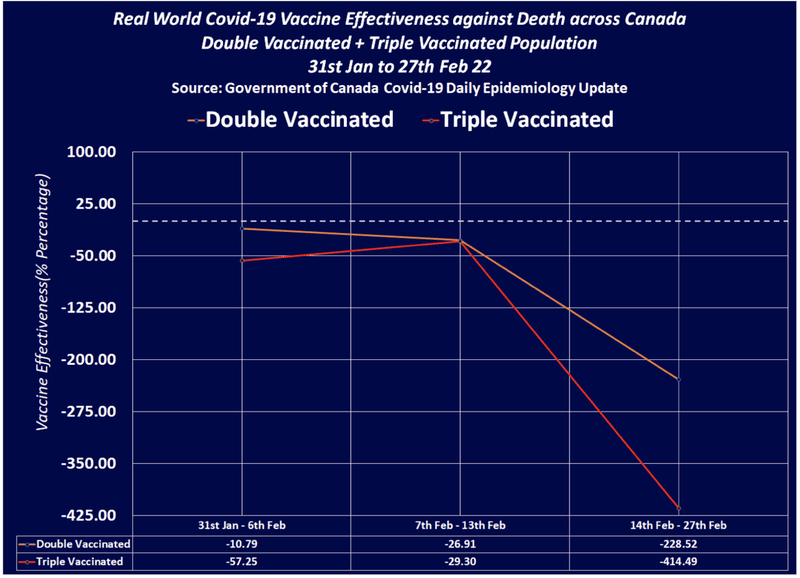
2月6日に終わる週では、2回接種者のワクチン効果はマイナス10.79%であった。しかし、2月27日に終わる週には、マイナス228.52%という非常にショッキングな数値にまで低下した。
しかし、3回ワクチン接種者の状況ははるかに悪い。2月6日に終わる週には、3回ワクチン接種者の実際のワクチン有効率はマイナス57.25%だった。しかし、2月27日に終わる週には、壊滅的なマイナス414.49%まで落ち込んでいる。
つまり、2回接種者はワクチン未接種者の3.3倍、3回接種者は5.1倍の確率でコビッド19で死亡することになる。
しかし、ワクチンの有効性はワクチンの効果ではなく、ワクチン接種を受けた人の免疫システムのパフォーマンスを、ワクチン未接種の人の免疫システムのパフォーマンスと比較したものであることを忘れてはならない。
以下のグラフは、カナダ全土における2回ワクチン接種者と3回ワクチン接種者の死亡に対する免疫システムの性能と、ワクチン未接種者の自然免疫システムの性能を比較したものである。
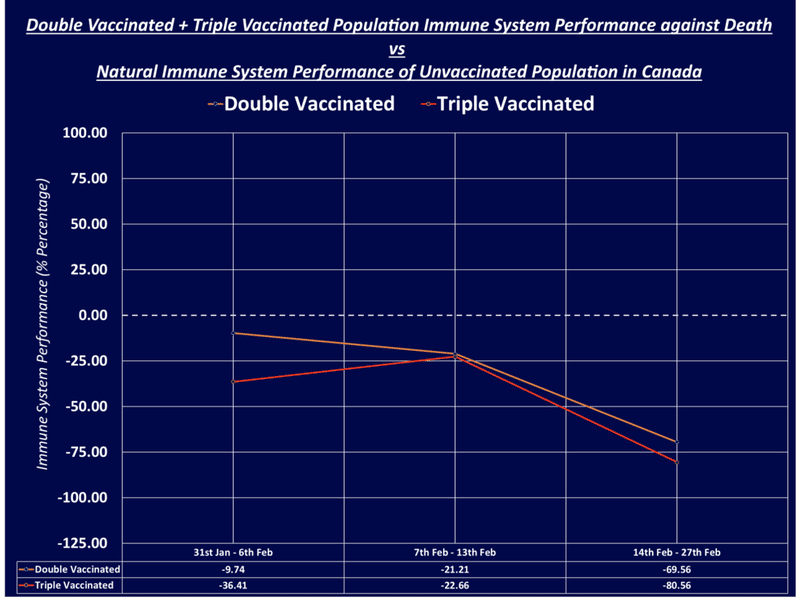
カナダ全土の2回ワクチン接種者は22年2月27日までにマイナス69.56%の免疫システム性能を示したが、カナダ全土の3回ワクチン接種者はマイナス80.56%の免疫システム性能を示した。これがコビッド19のワクチン接種がカナダ国民にもたらした結果である。
AIDS(後天性免疫不全症候群)とは、免疫系が著しく損傷した場合に起こる、生命を脅かす可能性のある多くの感染症や病気を表すのに使われる名称である。
後天性免疫不全症候群の人は、特定の癌を発症したり、通常は免疫力の弱い人にしか起こらない感染症にかかるリスクが高くなります。
残念なことに、カナダ政府の公式データによると、2回ワクチンや3回ワクチンを接種した人口の大部分が、後天性免疫不全症候群(AIDS)、あるいはコビッド19ワクチン誘発後天性免疫不全症候群(VAIDS)としか言いようのない、類似した性質を持つ新種の疾患を発症している。
原文:
Government of Canada data is truly terrifying; suggesting the Triple Vaccinated have developed “AIDS” & are now 5.1x more likely to die of Covid-19 than the Unvaccinated
BY THE EXPOSÉ
ON OCTOBER 1, 2023
The latest official Covid-19 figures from the Government of Canada are truly terrifying. They show that the double vaccinated population across Canada have now lost on average 74% of their immune system capability, and the triple vaccinated population across Canada have now lost on average 73% of their immune system capability compared to the natural immune system of unvaccinated people.
So much damage has now been done that the figures show the double vaccinated population are on average 3.8 times more likely to be infected with Covid-19 and 3.3 times more likely to die of Covid-19 than the unvaccinated population.
But it’s even worse for the triple vaccinated population in terms of their risk of death. The official figures show that they are on average 3.7 times more likely to be infected with Covid-19 but 5.1 times more likely to die of Covid-19 than the unvaccinated population.
These figures therefore suggest that both the double and triple vaccinated population in Canada have now had so much damage caused to their immune systems by the Covid-19 injections that they have now developed Acquired Immunodeficiency Syndrome.
The Canadian Covid-19 figures are produced by the Government of Canada (see here).
Their latest data is available as a downloadable pdf here.
The Government of Canada is publishing its official Covid-19 data in a way that makes it appear Canada is very much experiencing a ‘Pandemic of the Unvaccinated’, and that the Covid-19 vaccines are clearly effective. But this data is a fraud.
Page 20 onwards of the downloadable pdf contains data on Covid-19 cases, hospitalisations and deaths from the very start of the Covid-19 vaccination campaign in Canada on 14th Dec 20 all the way through to 27th Feb 22.
And it is this date parameter that makes the presented data extremely misleading, because there was a huge spike in Covid-19 cases, hospitalisations and deaths in January 2021 when just 0.3% of Canada were considered fully vaccinated.
But thanks to the gift of the ‘WayBackMachine’, we can look at previous Government of Canada Covid-19 Daily Epidemiology Update’ reports to deduce who is actually accounting for the majority of these deaths, hospitalisations and cases.
Here are the tables from the January 30th, February 6th, February 13th, February 20th, and February 27th, Government of Canada Covid-19 Daily Epidemiology Update’ reports showing the number of cases, hospitalisations and deaths by vaccination status from as far back as 14th December 2020, as well as the total population sizes of each vaccine group at the time of each report –
Source
Source
Source
Source
Source
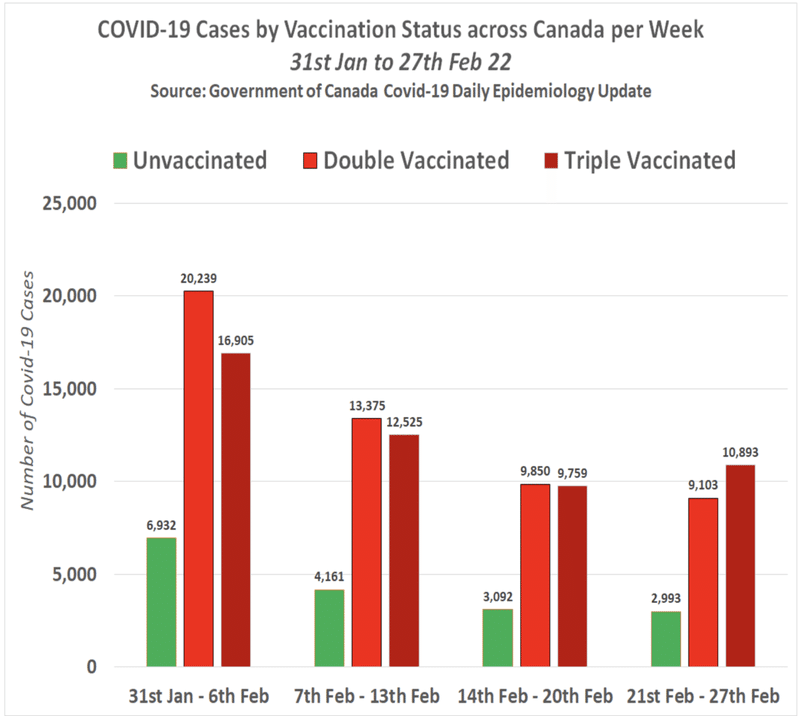
Now all we have to do is carry out simple subtraction to deduce who accounted for the majority of Covid-19 cases and when. The following chart shows the total number of Covid-19 cases per week by vaccination status across Canada between 31st Jan 22 and 27th Feb 22 –
As you can see the not-vaccinated population have accounted for the least amount of cases every single week, and they have fallen week on week from 6,932 in the week ending 6th Feb, to 2,993 in the week ending 27th Feb.
Whereas cases among both the double and triple vaccinated have been astronomically higher but still fell week on week, except for the week ending 27th Feb where we can see cases among the triple vaccinated started to climb again.
‘But this is to be expected when the unvaccinated population is so small!’, we hear you claim. But unfortunately you’re wrong.
The population of Canada is approximately 38.01 million.
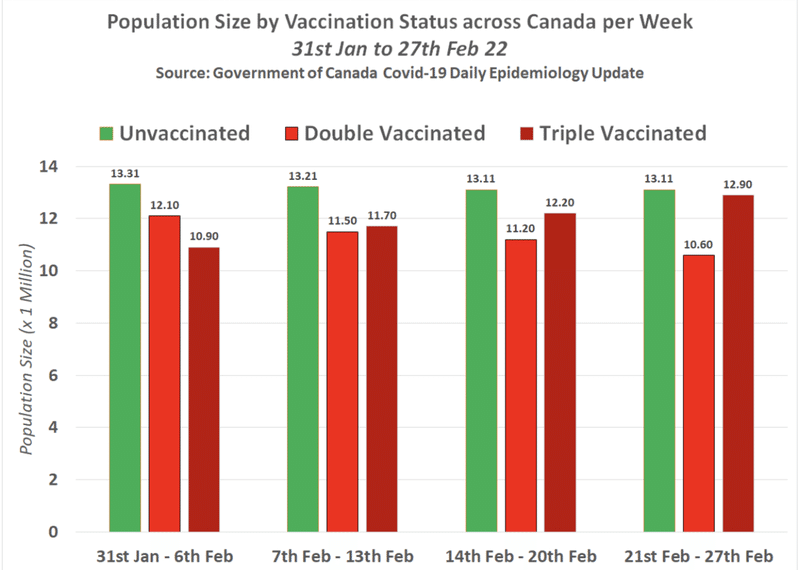
Therefore, based on the figures provided by the Government of Canada in the tables above, here is a chart showing the population size by vaccination status across Canada each week between 31st Jan and 27th Feb 22 –
The unvaccinated population size is deduced by simply subtracting the total population size of those who’ve received at least one dose of Covid-19 Vaccine in Canada from the overall population size of 38.01 million. The double vaccinated population size is simply deduced by subtracting the triple vaccinated population size from the total population size of those who’ve received at least two doses in Canada.
As you can see the largest population size is actually the unvaccinated population, falling from 13.31 million in the week ending 6th Feb to 13.11 million in the week ending 27th Feb. Whereas the triple vaccinated population has increased from 10.9 million in the week ending 6th Feb to 12.9 million in the week ending 27th Feb.
So why on earth are there so many more cases among the double vaccinated and triple vaccinated population when –
a) They have a smaller population size than the unvaccinated? &
b) They have had a vaccine that allegedly reduces their risk of contracting Covid-19?
The answer is obvious. It’s because the Covid-19 vaccines damage the immune system and make recipients more likely to contract Covid-19.
The following chart shows the Covid-19 case-rate per 100,000 individuals by vaccination status across Canada per week between 31st Jan and 27th Feb 22 –
The case-rate is deduced by first dividing the total population size of each vaccine group by 100,000. The number of cases in each vaccine group is then divided by the answer to the previous equation to calculate the case-rate.
e.g. –
13.31 million / 100,000 = 133.1
6,932 cases / 133.1 = 52.08 cases per 100,000 individuals
As you can see the case rate has been astronomically higher among both the double and triple vaccinated since at least the 31st Jan 22. Now that we know the case-rates we can use Pfizer’s vaccine effectiveness formula to work out the real world Covid-19 vaccine effectiveness among both the double vaccinated and triple vaccinated populations.
That formula is –
Unvaccinated Case Rate – Vaccinated Case Rate / Unvaccinated Case Rate x 100 = Vaccine Effectiveness %
The following chart shows the real-world Covid-19 vaccine effectiveness across Canada among the double vaccinated and triple vaccinated population based on the case-rates above-
In the week ending 6th Feb the real-world vaccine effectiveness among the double vaccinated was an absolutely shocking minus-221.16%. But by the week ending 27th Feb this had fallen even further to minus 276.16%.
But the triple vaccinated population, whilst faring ever so slightly better, have seen a much steeper decline. In the week ending 6th Feb the real world vaccinated effectiveness among the triple vaccinated was still a shocking minus minus-197.79%. But by the week ending 27th Feb this had fallen to minus-269.87%.
This means that on average, the double vaccinated population are 3.8 times more likely to contract Covid-19 than the unvaccinated, and the triple vaccinated population are 3.7 times more likely to contract Covid-19 than the unvaccinated.
But vaccine effectiveness isn’t really a measure of a vaccine, it is a measure of a vaccine recipients immune system performance compared to the immune system performance of an unvaccinated person.
The Covid-19 vaccine is supposed to train your immune system to recognise the spike protein of the original strain of the Covid-19 virus. It does this by instructing your cells to produce the spike protein, then your immune system produces antibodies and remembers to use them later if you encounter the spike part of the Covid-19 virus again.
But the vaccine doesn’t hang around after it’s done the initial training, it leaves your immune system to take care of the rest. So when the authorities state that the effectiveness of the vaccines weaken over time, what they really mean is that the performance of your immune system weakens over time.
The problem we’re seeing here is that the immune system isn’t returning to its original and natural state. If it was then the outcomes of infection with Covid-19 would be similar to the outcomes among the not-vaccinated population.
Instead, it continues to decline at a rate that means the not-vaccinated population have a better performing immune system, so this means the Covid-19 injections are decimating the immune systems of the fully vaccinated.
The following chart shows the double vaccinated and triple vaccinated immune system performance across Canada vs the natural immune system performance of the unvaccinated population –
The immune system performance is calculated by using a slightly different calculation to the one used to equate vaccine effectiveness, which is as follows –
Unvaccinated case rate – Vaccinated case rate / LARGEST OF EITHER unvaccinated case rate OR vaccinated case rate X 100 = Immune System Performance %
e.g. –
Triple Vaccinated 21st Feb to 27th Feb = 22.83 – 84.44 / 84.44 x 100 = -72.96%
These figures show that the average double vaccinated Canadian has lost 73.42% of their immune system capability, meaning they are down to the last 26.58% of their immune system for fighting certain classes of viruses and certain cancers etc.
But unfortunately, the third jab hasn’t improved things because these figures show the average triple vaccinated Canadian has lost 72.96% of their immune system capability, meaning they are down to the last 27.04% of their immune system for fighting certain classes of viruses and certain cancers etc.
However, the figures provided by the Government of Canada are not separated by age-group, instead they provide overall figures for the entire population. And as we know, vaccine effectiveness (which is really immune system performance), is declining by the week.
Therefore, it’s perfectly plausible to assume that those who received the vaccine first will now be suffering much more severe immune system degradation than those who have only just received their second or third jab. And based on the following official figures on death, we propose that many double and triple vaccinated Canadian’s have surpassed the minus-90% to minus-100% immune system performance barrier, meaning they have essentially developed some new form of Covid-19 vaccine induced Acquired Immune Deficiency Syndrome.
The following chart shows the total number of Covid-19 deaths per week by vaccination status across Canada between 31st Jan 22 and 27th Feb 22 –
We have had to group the last two weeks together because the 27th Feb report showed less deaths in all vaccination groups than the 20th Feb report, with the exception of triple vaccinated who saw an increase. So we deduced the number of deaths between the 14th Feb report and 27th Feb report.
As you can see, just like with cases there have been far more deaths among both the double and triple vaccinated, but special attention should be paid to the final two weeks.
The following chart shows the population size by vaccination status across Canada between 31st Jan and 27th Feb 22 –
The following chart shows the Covid-19 death-rate per 100,000 individuals by vaccination status across Canada per week between 31st Jan and 27th Feb 22 based on the death figures and population size figures above –
As you cans see the death rate has been lowest among the unvaccinated since at least 31st Jan 22, and highest among the triple vaccinated population. But the death rates shown for 14th Feb to 27th Feb are deeply troubling.
The following chart shows the real-world Covid-19 vaccine effectiveness against death across Canada among the double vaccinated and triple vaccinated population based on the death-rates above-
In the week ending 6th Feb the real-world vaccine effectiveness among the double vaccinated was a troubling minus-10.79%. But by the week ending 27th Feb this had fallen to an absolutely shocking minus-228.52%.
But things are far worse for the triple vaccinated. In the week ending 6th Feb the real-world vaccine effectiveness among the triple vaccinated was a disturbing minus-57.25%. But by the week ending 27th Feb this had fallen to devastating minus-414.49%.
This means that on average, the double vaccinated population are 3.3 times more likely to die of Covid-19 than the unvaccinated, but the triple vaccinated population are a shocking 5.1 times more likely to die of Covid-19 than the unvaccinated.
But don’t forget vaccine effectiveness isn’t really a measure of a vaccine, it is a measure of a vaccine recipient’s immune system performance compared to the immune system performance of an unvaccinated person.
The following chart shows the double vaccinated and triple vaccinated immune system performance against death across Canada vs the natural immune system performance of the unvaccinated population –
Double vaccinated individuals across Canada had an immune system performance of minus-69.56% by the 27th Feb 22, but triple vaccinated individuals across Canada had an immune system performance of minus-80.56%. This is what Covid-19 vaccination has done to the people of Canada.
AIDS (acquired immune deficiency syndrome) is the name used to describe a number of potentially life-threatening infections and illnesses that happen when your immune system has been severely damaged.
People with acquired immune deficiency syndrome are at an increased risk for developing certain cancers and for infections that usually occur only in individuals with a weak immune system.
Unfortunately, official Government of Canada data indicates that a large proportion of the double vaccinated and triple vaccinated population have now developed Acquired Immune Deficiency Syndrome, (AIDS) or a novel condition with similar attributes that can only be described as Covid-19 Vaccine Induced Acquired Immune Deficiency Syndrome (VAIDS).
この記事が気に入ったらサポートをしてみませんか?