
マーリー・サルビー教授:大気中の炭素は汚染物質ではなく、人間が規制することはできない

マーリー・サルビー教授:大気中の炭素は汚染物質ではなく、人間が規制することはできない
ローダ・ウィルソン
2024年6月8日
2016年、大気科学者のマリー・サルビー教授がユニバーシティ・カレッジ・ロンドンで講演を行った。講演の目的は、大気中の炭素がなぜ汚染物質ではないのか、なぜ人間がそれを規制できないのかを証明することであった。
化石燃料がCO2排出に与える影響は微々たるものである、とサルビー教授は言う。「化石燃料の摂動は小さすぎて、検出すらできない。 ......現時点では検出できない。今後も検出されることはないだろう」。
科学は "国連の庇護を受けた政府の官僚主義 "に乗っ取られている。その目的は、"検出不可能なものを予測しコントロールする社会工学の訓練になっている "と彼は2016年に語った。
マリー・サルビーとは?
マリー・サルビーは人為的な地球温暖化に批判的だった。 学術界における彼の最後の職は、オーストラリアのシドニーにあるマッコーリー大学の教授だった。
ウィキペディアによると、2013年、大学はサルビー教授を授業拒否と大学資源の不正使用を理由に解雇した。 DeSmogは、サルビー教授のプロフィールページで、"1988年から2013年の間に、サルビーは2つの主要大学の教員職を離れるに至った金銭その他の犯罪を犯した "と強調している。
マッコーリー大学に関しては、デスモッグは情報公開法(「FoI」)に基づき要求しなければアクセスできなかった社内報告書を使用したようだ。 デスモグは漠然と "FoIがあったに違いない "と言っているが、それを裏付けるリンクはない。 ジョー・ノヴァは、「結局のところ、法律的な言葉を並べた、水準の低い機密の内部文書が、人格攻撃をしたい連中に "リーク "されたのでしょう」と指摘した。
マッコーリー大学からのサルビー教授の解雇は、大学による一連の約束の不履行、大学による彼を妨害し黙らせようとする意図的な試み、そしてサルビー教授がフランスに滞在中に大学によって行われた不正行為の聴聞会に続いて行われた。 ジョー・ノヴァが当時指摘したように 彼の研究は、"地球温暖化 "という金食い虫にとって危険であり、何としてでも止めなければならなかったのだろうか?
サルビー教授は2022年に亡くなった。
気候変動のシナリオに逆らったことで迫害を受けたにもかかわらず、サルビー教授は、2016年にユニバーシティ・カレッジ・ロンドンで行った講演で示されたように、自分が真実だと知っていることについて発言することをやめなかった。
この講義の中で、サルビー教授は、気候変動カタストロフィ主義者が主張するように、二酸化炭素が汚染物質ではない理由を示した。

二酸化炭素は汚染物質ではない
大気中の炭素はほとんどすべて二酸化炭素の形をしている、とサルビー教授は説明した。 炭化水素の燃焼は酸化の一種であるため、二酸化炭素は汚染物質にはなり得ないと彼は言った。
燃焼は酸化反応の一種であり、物質に酸素が加わることで電子が失われ、酸化状態が上昇する。 燃焼では、燃料が酸素と反応し、熱、光、そして二酸化炭素や水などの酸化生成物を生成する。
気候変動 "の広告塔として使われているタワーから噴き出す "煙 "は水蒸気であり、二酸化炭素ではない、とサルビー教授は言う。

寒い朝に車の排気ガスから出てくる水蒸気もそうだ。 炭化水素の燃焼は酸化の一種である。 この過程では、同時に水蒸気を発生させなければCO2を発生させることはできない。 CO2と水は完全燃焼の生成物である。
例えば、メタンは単純な燃料です。 メタンの燃焼では、1分子の二酸化炭素が発生するごとに、2分子の水蒸気が発生する。
アパラチア石炭は、より複雑な燃料の一例である。 その燃焼では、CO2が3分子生成されるごとに、水蒸気が2分子生成される。
「気候に関しては、CO2に対する水蒸気の割合が2対1であろうと、2対3であろうと、実際には重要ではないのです」とサルビー教授は言う。 彼は、赤外線の不透明度を用いて、なぜそれが問題にならないかを説明した。
赤外線の不透明度
講演の中で、サルビー教授は『温室効果熱の捕捉能力』と書かれた下のグラフを提示した。 この図は、すべての温室効果ガスの上に集まる赤外線(IR)の波長に対する大気の不透明度を示している。
不透明度とは、電磁波やその他の放射線を通さない度合いのことである。 赤外線は電磁放射の一種で、波長は可視光線より長くマイクロ波より短い。
赤外線放射の文脈では、不透明度は赤外線放射の吸収と散乱を表す。 大気中の赤外放射の不透明度は、水蒸気、CO2、他のガス(メタン、オゾン、亜酸化窒素など)、気温など様々な要因に影響される。
サルビー教授が説明するように、赤外放射の不透明度は「放射熱を地表に閉じ込めるもの」である。 EPAがCO2による「絶滅危惧」を認定した前提でもある。" EPAとは、米国環境保護庁の頭文字をとったものである。

上の画像では、ほとんどすべての波長(横軸)において、不透明度(縦軸)がすでに100%吸収される最大値になっていることに注目してほしい、とサルビー教授は指摘する。 これはグレーの網掛けで示されている。
では、どのような大気ガスが赤外線のほぼ100%の不透過に寄与しているのだろうか?
サルビー教授は、CO2がオパシティに与える寄与をオパシティ全体のグラフの下に置いた。 CO2は赤外放射の不透明度全体の10%以下であるとサルビー教授は述べた。

そして、赤外放射の残りの不透明度のほとんどすべては、下の画像の青で示されているように、水蒸気によるものであると説明した。
「CO2が放射線を吸収する波長でさえ、水蒸気は吸収可能な最大値の半分以上を吸収している。 「CO2の変化によって影響を受けるのは、残りの半分以下だけである......したがって、(水蒸気の)熱捕獲能力はCO2の熱捕獲能力をはるかに上回る。

先に述べたように、炭化水素の燃焼ではCO2と同時に水蒸気も発生する。 つまり、CO2とともに水蒸気も放出されているのだ。 水蒸気の熱トラップ能力がCO2の熱トラップ能力を大きく上回っている(上の画像)ことを加味すると、結論はサルビー教授の言うとおりとなる: 「CO2が汚染物質になるのは、水蒸気が汚染物質になる日である。
「CO2排出を回避するエネルギー源は、クリーンでもグリーンでもない」と彼は付け加えた。
化石燃料によるCO2排出は大気中のCO2にどのような役割を果たしているか
国連の気候変動に関する政府間パネル(IPCC)は、人為起源の大気中のCO2はすべて化石燃料に由来するという単純な見解を示している。
現実はどうなのか?
下の画像のグラフを示しながら、サルビー教授はこう説明した: 「今世紀に入る前の10年間、化石燃料の排出量はほぼ直線的に増加した。 その後の10年間、CO2は直線的に増加したが、そのスピードは3倍であった。 この増加は、一番上のグラフの線の急峻さに見ることができる。
曲線下の面積は、大気中に排出されたCO2を表している。 「第二の10年間は、第一の10年間よりもはるかに多く、200%も多く排出されました。
「同じ期間、大気中のCO2も直線的に増加した。 これは2番目のグラフを見ればわかる。
最初の10年間で、大気中のCO2は体積比で約20ppm増加した。 第二の10年間は、化石燃料の排出とは異なり、大気中のCO2の増加は第一の10年間とほぼ同じであった。

「第二の10年間の化石燃料の排出量は、第一の10年間の3倍であった。 しかし、大気中のCO2の増加に対する人為的な影響は、事実上ゼロでした」とサルビー教授は言った。
「追加された人為起源のCO2がどこに行き着いたかはわからない。 大気中のCO2が最終的にどこに到達しなかったかは明らかです」と付け加えた。
「化石燃料の排出が主な原因であるというIPCCの前提はありえない」とサルビー教授は言った。 なぜか?
なぜなら、「もし化石燃料の排出が大気中のCO2増加のわずか10%であったとしたら、2年目の10年間の大気中のCO2増加は、最初の10年間よりも30%も大きかったはずだ - それどころではなかったのです」と彼は説明する。
下の図は、IPCCによるCO2収支の推定である。 「総排出量のうち、人為的な排出はわずか2、3パーセントです。 残りの95%以上は自然放出によるものです。 自然ミッションのわずかな変化でさえ、人間による排出を覆い隠してしまうのです」とサルビー教授は語った。

IPCCの気候変動モデル
続いてサルビー教授は、大気中のCO2に対する人為起源のCO2の寄与を決定するために気候モデルで使用されている仮定と数式について詳しく説明した。
すべてを支える原理は保存則です。 物理学における保存則とは、ある物理的性質(つまり測定可能な量)は、孤立した物理系内では時間の経過とともに変化しないという原則である。 要するに、入るものは出なければならない。
保存則は平衡と密接な関係がある。 保存則は、ある物理量が時間とともに一定に保たれることを保証するが、平衡とは、物体やシステムに作用する正味の外力がゼロである状態を指す。 大気中のCO2の場合、放出と吸収が等しいときに平衡に達する。 均衡が外力によって乱されると、新たな均衡が確立される。
世界的なCO2排出量の問題は、排出量を計算できるほど世界的な吸収量がわかっていないことだ。 しかし、IPCCはそう考えている、とサルビー教授は言う。
上の画像に見られるように、IPCCは世界全体の炭素吸収量は150ギガトンだと考えている。 「実際のところ、(150ギガトンという数字は)推測に過ぎない。 世界的な吸収の観測は存在しません」と言う。
「それゆえ、IPCCが推定する主要な寄与率が100%も変化することは、驚くべきことではないのです」と付け加えた。
CO2吸収量を決定する方法がある
1950年代から1960年代にかけて、核爆弾の実験によって炭素14(「C14」)が上昇した。 C14は炭素の放射性同位元素で、宇宙線と窒素14原子の相互作用によって大気圏上層部で自然に生成される。 このプロセスは宇宙線核破砕として知られている。 生成されたC14原子は酸素と結合してCO2になる。
「核源は1963年の核実験禁止条約によって取り除かれた。 C14はその後、不均衡な吸収によって崩壊しました」とサルビー教授は説明した。 サルビー教授が言う "不均衡 "とは、平衡の乱れのことである。 「減衰はほぼ完全に指数関数的で、吸収時間は10年弱でした。
これをIPCCの気候モデルにおけるCO2の吸収と比較すると、「200年後でも、最初に存在したCO2のほぼ30%が残っている」とサルビー教授は述べ、下のグラフを示した。 青と緑の線は核実験によるC14の吸収(崩壊してCO2を生成)、ピンクの線はIPCCの気候モデルによる吸収を表している。

もう一つの擾乱、すなわち不均衡な吸収の導入は、化石燃料であり、これはCO2の人為起源成分を導入する。 「化石燃料の排出では、保存則が人為起源成分を完全に決定することが知られている。
最も遅い吸収が "上限 "を決定する。 この最も遅い吸収は、C14の崩壊で10年である。
自由大気のCO2観測は1960年に始まった。" 1960年以前のすべての年において、化石燃料の排出量は最大値、すなわち1960年の化石燃料の排出量と等しかったと仮定すると、上限が決まる。 思い出してください、摂動が平衡レベルを超えることはないのです」。
このことから、サルビー教授は、1960年における人為起源のCO2の上限(10ppmv)と、大気中のCO2全体に占めるその割合(24%)を計算することができた。 これを基準として、サルビー教授は、過去50年間の人為起源CO2の上限は約20ppmv増加し、これは大気中のCO2増加の28%にあたる、と計算した。
人為起源CO2の増加は気温にどのような影響を与えるか?
サルビー教授は、この上限値28%を用いて、人為起源のCO2による気温上昇を見積もった。 ここで、赤外放射の不透明度が関係してくる。
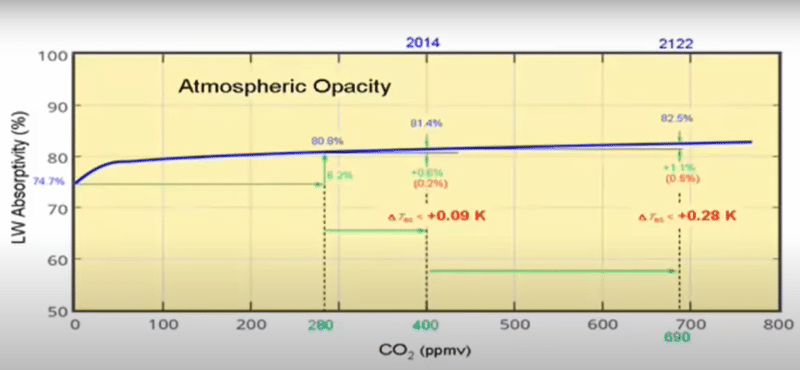
ほとんどの波長のオパシティはすでに100%で飽和しており、集団的なオパシティは75%で頭打ちになっている、とサルビー教授は説明した。 CO2を280ppmvまで増加させてもオパシティは6%しか増加せず、さらに400ppmvまで増加させても、さらに半分しか増加しないと彼は言う。 「これまで見てきたように、化石燃料の摂動による温度上昇はその30%以下(28%)である。 それは、10分の1度(摂氏)以下の温度摂動をもたらします」。
「化石燃料の埋蔵量の予測寿命は約100年です。 現在のCO2の増加率では、オパシティはさらに1%増加する。 その場合でも、化石燃料の摂動は増加の40%以下であり、10分の3度以下の温度摂動しかもたらさない。 「100年間の累積化石燃料摂動は半度以下である。
「(気温の)自然変動の幅は半度から1度です。 これは化石燃料の摂動よりもかなり大きい」とサルビー教授は言う。 「フィードバックによる大きな増幅がなければ、化石燃料による摂動は検出すらできない。 自然変動のノイズよりも小さいのです」。
上記はすべて上限であり、化石燃料の影響がこれ以上大きくなることはないということである。 しかし、もっと小さくなることもあります。 とサルビー教授は語った。
CO2吸収に関するより明確な扱い
CO2排出に対する擾乱や摂動は、一時的に導入され、その後システムから取り除かれる。 この摂動の一時的な性質によって、CO2吸収量をより明確に計算することができる。
CO2は気温の変化により変動し、CO2の排出量を変化させます。 排出の摂動は温度の摂動に比例します。 気温の変化はCO2に比例した変化をもたらします。 しかし、CO2の変化と気温の変化にはタイムラグがあります。 CO2の変化は気温の変化に遅れます。
自然は、科学者がこのラグと気温がCO2排出に及ぼす影響を研究するための摂動を提供している。 エルニーニョ、ラニーニャ、火山噴火のような毎年の擾乱は、地球の気温を変動させ、CO2排出量を変動させる。 気温の変化に対するCO2排出のタイムラグを確定するために、これらの事象を利用することで、CO2の吸収時間を決定することができる。 これらの事象の観測を用いると、吸収時間は9カ月と計算される。
「これは、炭素14の崩壊で明らかになるよりも10倍速い」とサルビー教授は言う。 どうしてそうなるのか?
要するに、「炭素14は嘘をついたが、意図的ではなかった」ということだ。 上昇したC14が大気圏外に持ち出されると、大気圏外に留まると推測されている。 「それは不可能です」と彼は言い、ここでは詳細を記していないが、なぜ不可能なのかを説明した。
「吸収期間が1年(9ヶ月)未満であることから、CO2増加の人為起源分率は30%より小さいどころか、3%より小さいのです」と彼は言った。
CO2の自然変動
「9月から5月までの8ヶ月の間に、CO2は7.5ppmv増加した。 その後4ヶ月の間に、CO2は約6ppmv減少します」とサルビー教授は説明した」とサルビー教授は説明した。 この4ヶ月でCO2が減少する唯一の理由は、不均衡な吸収によるものだという。
「毎年CO2は1.5ppmvずつ5段階上昇し、その後4段階下降する。 5段階上昇、4段階下降......各サイクルの後の残留量は1.6ppmvである。 心当たりはないだろうか? これはCO2のトレンドと同じです」と言った。
この年間ステップアップ・ステップダウンのCO2サイクルは、CO2摂動の80%が4ヶ月で吸収されることを示しており、CO2の吸収時間は、気温に対するCO2の遅れ法で計算される9ヶ月よりも短いことを示している。 CO2の年間平均吸収期間は7.5ヶ月と計算される。
化石燃料によるCO2の年間増加量は?
毎年、CO2総量は1.6ppmv増加している。 そのうち0.1ppmvは人為的な排出によるものです。 「年間わずか0.1ppmvで、追加的な人為的排出は追加的な総排出量に取って代わられます」とサルビー教授は言う。
彼は、1960年以降のCO2総排出量の増加に占める人為的なCO2排出の割合をさまざまな方法で計算した。 いずれも3%未満(1.3%~2.8%)である。 IPCCは、人為的なCO2排出はすべて化石燃料によるものと仮定している。 この仮定に基づけば、化石燃料の排出がCO2排出の増加に寄与するのは3%以下ということになる。
「化石燃料の摂動は微小である」とサルビー教授は言う。 「化石燃料の摂動は小さすぎて検出すらできない。 それは検出できないだろう」。
気候変動アジェンダの提唱者たちが化石燃料の排出に関する劇的な表現を使っていることについて、サルビー教授は次のように述べた: 「これほど少ないという前提で、これほど多くのことが主張されたことはない」。
以下、サルビー教授のプレゼンテーションを埋め込み、最後の10分で結論を述べている。 彼のプレゼンをフルで見ることができないなら、この10分間は聞く価値がある。 彼は、"国連の庇護の下にある政府官僚 "による科学の破壊について語った。 その目的は、"検出不可能なものを予測しコントロールする社会工学の訓練になっている "と彼は2016年に述べた。
マリー・サルビー教授講演:「大気中の炭素」2016年7月18日(85分)
スペイン語訳:
Prof. Murry Salby: El carbono atmosférico no es un contaminante y el ser humano no puede regularlo
POR RHODA WILSON
EL 8 DE JUNIO DE 2024
En 2016, el profesor Murry Salby, científico atmosférico, pronunció una conferencia en el University College de Londres. El objetivo de su conferencia era demostrar por qué el carbono atmosférico no es un contaminante y por qué el ser humano no puede regularlo.
El efecto de los combustibles fósiles en las emisiones de CO2 es ínfimo, dijo el Prof. Salby. "La perturbación de los combustibles fósiles es demasiado pequeña incluso para ser detectable ... [Es] actualmente no detectable. No será detectable, nunca".
La ciencia ha sido tomada por "la burocracia gubernamental bajo la égida de la ONU". Su objetivo, dijo en 2016, "se ha convertido en un ejercicio de ingeniería social para predecir y controlar lo indetectable."
¿Quién es Murry Salby?
Murry Salby fue crítico con el calentamiento global antropogénico. Su último puesto en el mundo académico fue como profesor en la Universidad Macquarie de Sidney (Australia).
Según Wikipedia, en 2013 la universidad despidió al Prof. Salby por negarse a enseñar y mal uso de los recursos universitarios. DeSmog destacó en la página de perfil del profesor Salby que "entre 1988 y 2013, Salby cometió delitos financieros y de otro tipo que le llevaron a abandonar puestos de profesor en dos importantes universidades."
En cuanto a la Universidad Macquarie, parece que DeSmog utilizó un informe interno al que no se podría haber tenido acceso sin solicitarlo en virtud de la Ley de Libertad de Información ("FoI"). "DeSmog sugiere vagamente que 'debe haber habido un FoI', pero no hay enlaces que lo apoyen. Al final, un documento interno confidencial, de bajo nivel, con palabras que suenan legalistas, puede haber sido 'filtrado' a aquellos en busca de un ataque de carácter", señaló Jo Nova.
El despido del profesor Salby de la Universidad Macquarie se produjo tras una serie de compromisos incumplidos por parte de la universidad, intentos deliberados por parte de la universidad de sabotearle y silenciarle y una vista por mala conducta celebrada por la universidad mientras el profesor Salby se encontraba en Francia. Como Jo Nova señaló en su momento: "¿Es su investigación tan peligrosa para la gallina de los huevos de oro que es el 'calentamiento global' que tenía que ser detenida a cualquier precio?"
El profesor Salby murió en 2022.
A pesar de la persecución que sufrió por ir en contra de la narrativa del cambio climático, el profesor Salby no dejó de hablar sobre lo que él sabía que era la verdad, como lo demuestra la conferencia que dio en el University College de Londres en 2016.
Durante esta conferencia, el profesor Salby demostró por qué el dióxido de carbono no es un contaminante como afirman los catastrofistas del cambio climático
El dióxido de carbono no es un contaminante
Casi todo el carbono de la atmósfera está en forma de dióxido de carbono, explicó el profesor Salby. El dióxido de carbono no puede ser un contaminante, dijo, porque la combustión de hidrocarburos es una forma de oxidación.
La combustión es un tipo de reacción de oxidación porque implica la adición de oxígeno a una sustancia, lo que provoca la pérdida de electrones y un aumento del estado de oxidación. En la combustión, el combustible reacciona con el oxígeno para producir calor, luz y productos oxidados, como dióxido de carbono y agua.
Las columnas de "humo" que se ven salir de las torres que se utilizan como reclamo del "cambio climático" son vapor de agua, no CO2, dijo el profesor Salby.
También es vapor de agua lo que se ve salir de los tubos de escape de los coches en una mañana fría. Y el mismo proceso de oxidación impulsa el cuerpo humano. En este proceso, no se puede producir CO2 sin producir simultáneamente vapor de agua. El CO2 y el agua son los productos de una combustión perfecta.
El metano, por ejemplo, es un combustible simple. En la combustión del metano, por cada molécula de CO2 producida, se producen dos moléculas de vapor de agua.
El carbón de los Apalaches es un ejemplo de combustible más complejo. En su combustión, por cada tres moléculas de CO2 producidas, se producen dos moléculas de vapor de agua.
"En lo que respecta al clima, que la proporción entre vapor de agua y CO2 sea de dos a uno o de dos a tres realmente no importa", dijo el Prof. Salby. Explicó por qué no importa utilizando la opacidad de la radiación infrarroja.
Opacidad de la radiación infrarroja
En su conferencia, el profesor Salby presentó el siguiente gráfico titulado "Capacidad de captura de calor de efecto invernadero". Muestra la opacidad de la atmósfera para las longitudes de onda de la radiación infrarroja ("IR") captada sobre todos los gases de efecto invernadero.
La opacidad se refiere a la medida de impenetrabilidad a la radiación electromagnética o de otro tipo. La radiación infrarroja es un tipo de radiación electromagnética con una longitud de onda superior a la de la luz visible pero inferior a la de las microondas.
En el contexto de la radiación IR, la opacidad describe la absorción y dispersión de la radiación IR. En la opacidad de la radiación IR en la atmósfera influyen diversos factores, como el vapor de agua, el CO2, otros gases (como el metano, el ozono y el óxido nitroso) y la temperatura.
Como explicó el profesor Salby, la opacidad de la radiación IR es "lo que atrapa el calor radiante en la superficie de la Tierra". También es la premisa de la constatación de la EPA de "peligro" por el CO2." EPA es el acrónimo de la Agencia de Protección Medioambiental de Estados Unidos.
En la imagen superior, obsérvese que en casi todas las longitudes de onda (eje horizontal) la opacidad (eje vertical) alcanza ya el máximo posible de absorción del 100%, señaló el Prof. Salby. Así lo indica la zona sombreada en gris.
La pregunta entonces es: ¿Qué gases atmosféricos contribuyen a la opacidad de casi el 100% de la radiación IR?
El Prof. Salby situó la contribución del CO2 a la opacidad por debajo del gráfico de opacidad total, que se muestra en verde en la imagen inferior. El CO2 representa menos del 10% de la opacidad total de la radiación IR, dijo el Prof. Salby.
A continuación, explicó que casi toda la opacidad restante de la radiación IR procede del vapor de agua, como se muestra en azul en la imagen inferior.
"Obsérvese que, incluso en las longitudes de onda en las que el CO2 absorbe la radiación, el vapor de agua absorbe más de la mitad del máximo posible", explica el profesor Salby. "Sólo lo que queda -menos de la mitad- está influido por los cambios de CO2 ... [Por lo tanto], la capacidad de captura de calor [del vapor de agua] supera ampliamente la capacidad de captura de calor del CO2".
Como ya se ha dicho, en la combustión de hidrocarburos se produce vapor de agua al mismo tiempo que CO2. En otras palabras, el vapor de agua se emite junto con el CO2. Si a esto añadimos que la capacidad de captura de calor del vapor de agua supera con creces la capacidad de captura de calor del CO2 (como se ve en la imagen de arriba), la conclusión sólo puede ser la que dijo el profesor Salby: "El CO2 será un contaminante el día que lo sea el vapor de agua".
"De ello se deduce que las fuentes de energía que eluden la emisión de CO2 no son ni más limpias ni más ecológicas, simplemente son diferentes", añadió.
¿Qué papel desempeña la emisión de CO2 por combustibles fósiles en el CO2 atmosférico?
El Grupo Intergubernamental de Expertos sobre el Cambio Climático de las Naciones Unidas ("IPCC") adopta la visión simplista de que todo el CO2 atmosférico antropogénico procede de los combustibles fósiles.
¿Cuál es la realidad?
Compartiendo los gráficos de la imagen inferior, el Prof. Salby explicó: "Durante la década anterior al cambio de siglo, las emisiones de combustibles fósiles aumentaron casi linealmente. Durante la década siguiente, también aumentó linealmente, pero tres veces más rápido". Este aumento puede apreciarse en la inclinación de las líneas del gráfico superior.
El área bajo la curva representa el CO2 que se emitió a la atmósfera. "Durante la segunda década se emitió mucho más que durante la primera: un 200% más", afirmó.
"Durante el mismo periodo, el CO2 atmosférico también aumentó linealmente", dijo. Esto puede verse en el segundo gráfico.
En la primera década, el CO2 atmosférico aumentó unas 20 partes por millón en volumen ("ppmv"). Durante la segunda década, a diferencia de las emisiones de combustibles fósiles, el aumento del CO2 atmosférico fue prácticamente idéntico al de la primera década.
"La emisión de combustibles fósiles durante la segunda década fue tres veces superior a la de la primera. Sin embargo, su impacto en el aumento del CO2 atmosférico fue prácticamente nulo", afirmó el Prof. Salby.
"No se puede decir dónde fue a parar el CO2 antropogénico adicional. Dónde no fue a parar [es decir, a la atmósfera] es inequívoco", añadió.
"La premisa del IPCC de que el aumento del CO2 atmosférico se debe principalmente a la emisión de combustibles fósiles es imposible", afirmó el profesor Salby. ¿Por qué?
Porque "si la emisión de combustibles fósiles representara tan sólo el 10% del aumento del CO2 atmosférico, el incremento atmosférico durante la segunda década habría sido un 30% mayor que durante la primera, ni siquiera estuvo cerca", explicó.
El gráfico siguiente de una estimación del presupuesto de CO2 procede del IPCC. "De la emisión total, la humana sólo representa un par de puntos porcentuales. El resto -más del 95%- procede de la emisión natural. Incluso un cambio menor de la misión natural eclipsaría la emisión humana", dijo el Prof. Salby.
Modelos de cambio climático del IPCC
A continuación, el profesor Salby expuso detalladamente los supuestos y ecuaciones matemáticas utilizados en los modelos climáticos para determinar la contribución del CO2 antropogénico al CO2 atmosférico.
El principio que lo sustenta todo es la ley de conservación. La ley de conservación, en física, es un principio que establece que una determinada propiedad física (es decir, una cantidad mensurable) no cambia con el tiempo dentro de un sistema físico aislado. En resumen, lo que entra debe salir.
La ley de conservación está estrechamente relacionada con el equilibrio. Mientras que la ley de conservación garantiza que ciertas cantidades físicas permanezcan constantes a lo largo del tiempo, el equilibrio es un estado en el que la fuerza externa neta que actúa sobre un objeto o sistema es cero. En el caso del CO2 atmosférico, el equilibrio se alcanza cuando la emisión es igual a la absorción. Si el equilibrio se ve perturbado por una fuerza externa, se establecerá un nuevo equilibrio.
El problema con las emisiones globales de CO2 es que no conocemos la absorción global para poder calcular la tasa de emisión. Sin embargo, el IPCC cree que no es así, dijo el Prof. Salby.
Como se ve en la imagen superior, el IPCC cree que la absorción mundial es de 150 gigatoneladas de carbono. "En realidad [las 150 gigatoneladas] son poco más que una estimación. No existen observaciones de la absorción global", afirmó.
"Por tanto, no debería sorprendernos que las estimaciones del IPCC sobre las principales contribuciones cambien hasta en un cien por cien", añadió.
Existe una forma de determinar la absorción de CO2
Durante las décadas de 1950 y 1960, las pruebas con bombas nucleares elevaron el carbono 14 ("C14"). El C14 es un isótopo radiactivo del carbono que se produce de forma natural en la atmósfera superior por la interacción de los rayos cósmicos con los átomos de nitrógeno-14. Este proceso se conoce como rayos cósmicos. Este proceso se conoce como espalación de rayos cósmicos. Los átomos de C14 producidos se combinan con el oxígeno para formar CO2.
"La fuente nuclear fue eliminada en 1963 por el tratado de prohibición de pruebas nucleares. El C14 se desintegró por absorción desequilibrada", explicó el profesor Salby. Por "desequilibrio", el Profesor Salby se refiere a una perturbación en el equilibrio. "La desintegración fue casi perfectamente exponencial, con un tiempo de absorción de algo menos de una década", explicó.
Comparando esto con la absorción de CO2 en los modelos climáticos del IPCC, "incluso después de 200 años queda casi el 30% del CO2 presente inicialmente", dijo el Prof. Salby y presentó el gráfico siguiente. La línea azul/verde representa la absorción del C14 de las pruebas nucleares (que decae para producir CO2) y la línea rosa representa la absorción según los modelos climáticos del IPCC.
Otra perturbación, o introducción de una absorción desequilibrada, son los combustibles fósiles, que introducen un componente antropogénico de CO2. "Con la emisión de combustibles fósiles [se sabe]... la ley de conservación determina completamente el componente antropogénico", dijo el Prof. Salby.
La absorción más lenta determina el "límite superior". La absorción más lenta es la del C14, que tarda 10 años.
La observación del CO2 en la atmósfera libre comenzó en 1960". Se obtiene un límite superior suponiendo que, en todos los años anteriores a 1960, la emisión de combustibles fósiles fue igual a su máximo, es decir, la emisión de combustibles fósiles en 1960. Recordemos que la perturbación nunca supera su nivel de equilibrio".
A partir de esto, el Prof. Salby pudo calcular el límite superior del CO2 antropogénico en 1960 (10 ppmv) y su proporción respecto al CO2 atmosférico total (24%). Tomando esto como referencia, el Prof. Salby calculó que el límite superior del CO2 antropogénico en los últimos 50 años aumentó aproximadamente 20 ppmv, un 28% del aumento total del CO2 atmosférico.
¿Qué efecto tiene el aumento del CO2 antropogénico sobre la temperatura?
A continuación, el profesor Salby utilizó este límite superior del 28% para estimar el aumento de la temperatura debido al CO2 antropogénico. Aquí es donde la opacidad de la radiación IR adquiere relevancia.
La opacidad en la mayoría de las longitudes de onda ya está saturada, en el 100%, y la opacidad colectiva se ha estabilizado en el 75%, explicó el Prof. Salby. Aumentar el CO2 a 280 ppmv sólo añade un 6% a la opacidad y aumentar aún más el CO2 a 400 ppmv sólo añade otro medio por ciento, dijo. "Como hemos visto, menos del 30% [28%] de ese aumento corresponde a la perturbación de los combustibles fósiles. Introduce una perturbación de la temperatura de menos de una décima de grado [Celsius]".
"La vida útil prevista para las reservas de combustibles fósiles es de unos 100 años. Con el crecimiento actual del CO2, la opacidad habrá aumentado otro 1%. Incluso entonces, la perturbación de los combustibles fósiles representa menos del 40% del aumento: introduce una perturbación adicional de la temperatura de menos de tres décimas de grado", dijo. "La perturbación acumulada de los combustibles fósiles [a lo largo de 100 años] es inferior a medio grado".
"El rango de variabilidad natural [de la temperatura] es de medio grado a un grado. Eso es considerablemente mayor que la perturbación de los combustibles fósiles", dijo el Prof. Salby. "Sin una amplificación importante por retroalimentación, la perturbación de los combustibles fósiles ni siquiera es detectable. Es menor que el ruido de la variabilidad natural".
Todo lo anterior es una cota superior, el límite superior, lo que significa que los efectos de los combustibles fósiles no pueden ser mayores. Sin embargo, puede ser menor. Y resulta que lo es, dijo el Prof. Salby.
Un tratamiento más definitivo de la absorción de CO2
Una perturbación o perturbación a la emisión de CO2 se introduce temporalmente y luego se elimina de un sistema. Este carácter temporal de las perturbaciones permite un cálculo más definitivo de la absorción de CO2.
El CO2 se ve perturbado por los cambios de temperatura, que modulan su emisión. La perturbación de la emisión es proporcional a la perturbación de la temperatura. Así pues, los cambios de temperatura producirán cambios proporcionales en el CO2. Sin embargo, existe un desfase temporal entre los cambios de CO2 y el cambio de temperatura. Los cambios de CO2 van por detrás de los cambios de temperatura.
La naturaleza proporciona perturbaciones que permiten a los científicos estudiar este desfase y el efecto que tiene la temperatura en la emisión de CO2. Las perturbaciones anuales como El Niño, La Niña y las erupciones volcánicas perturban la temperatura global, lo que perturba la emisión de CO2. Utilizando estos eventos para establecer el retraso de la emisión de CO2 con respecto a la temperatura, se puede determinar el tiempo de absorción del CO2. Mediante la observación de estos fenómenos, se ha calculado que el tiempo de absorción es de 9 meses.
"Es 10 veces más rápido de lo que se observa en la desintegración del carbono 14", explica el profesor Salby. ¿Cómo es posible?
La respuesta corta, dijo, es que "el carbono-14 mintió, pero no intencionadamente". Se supone que cuando el C14 elevado se sacaba de la atmósfera, se quedaba fuera de ella. "Eso es imposible", dijo y, aunque no hemos anotado los detalles aquí, explicó por qué era imposible.
"Con un tiempo de absorción de menos de un año [9 meses], la fracción antropogénica del aumento de CO2 no es sólo inferior al 30%, es inferior al 3%", dijo.
Fluctuaciones naturales de CO2
"Durante un intervalo de ocho meses, de septiembre a mayo, el CO2 aumenta en 7,5 ppmv. Durante el intervalo posterior de cuatro meses, el CO2 disminuye entonces unas 6 ppmv", explicó el profesor Salby. Señaló que la única razón por la que el CO2 disminuye en esos cuatro meses se debe a una absorción desequilibrada.
"Cada año, el CO2 sube cinco escalones de 1,5 ppmv, y luego baja cuatro escalones. Cinco escalones arriba, cuatro escalones abajo... observe que el residuo después de cada ciclo es de 1,6 ppmv. ¿Le suena? Es idéntica a la tendencia del CO2", afirmó.
Este ciclo anual de subida y bajada del CO2, en el que el 80% de la perturbación del CO2 se absorbe en cuatro meses, demuestra que el tiempo de absorción del CO2 es inferior a los 9 meses calculados con el método del retraso del CO2 respecto a la temperatura. Utilizando el ciclo anual del CO2, el tiempo medio anual de absorción del CO2 se calcula en 7,5 meses.
¿Qué parte del aumento anual de CO2 se debe a los combustibles fósiles?
Cada año, el CO2 total aumenta 1,6 ppmv. De esa cantidad, 0,1 ppmv se debe a la emisión antropogénica. "Con sólo 0,1 ppmv al año, la emisión antropogénica adicional queda eclipsada por la emisión total adicional", afirmó el Prof. Salby.
Utilizó varios métodos para calcular la proporción de las emisiones antropogénicas de CO2 en el aumento total de las emisiones de CO2 desde 1960. Todos los resultados fueron inferiores al 3% (entre el 1,3% y el 2,8%). El IPCC supone que todas las emisiones antropogénicas de CO2 proceden de los combustibles fósiles. Partiendo de esta hipótesis, significa que la emisión de combustibles fósiles contribuye en menos de un 3% al aumento de la emisión de CO2.
"La perturbación de los combustibles fósiles es ínfima", dijo el Prof. Salby. "La perturbación de los combustibles fósiles es demasiado pequeña para ser detectable... [Actualmente] no es detectable. No será detectable, nunca".
Hablando del lenguaje dramático relativo a las emisiones de combustibles fósiles utilizado por los defensores de la agenda del cambio climático, el Profesor Salby dijo: "Nunca se ha afirmado tanto sobre la base de tan poco".
A continuación, hemos incrustado la presentación del Prof. Salby para comenzar en los últimos 10 minutos donde comienza su conclusión. Si no puede ver su presentación completa, vale la pena escuchar estos 10 minutos. Habla de la subversión de la ciencia por "la burocracia gubernamental bajo la égida de la ONU". Su objetivo, dijo en 2016, "se ha convertido en un ejercicio de ingeniería social para predecir y controlar lo indetectable."
Conferencia del profesor Murry Salby: 'El carbono atmosférico', 18 de julio de 2016 (85 minutos)
原文:
Prof. Murry Salby: Atmospheric carbon is not a pollutant and humans cannot regulate it
BY RHODA WILSON
ON JUNE 8, 2024
In 2016 atmospheric scientist Professor Murry Salby delivered a lecture at University College London. The purpose of his lecture was to provide proof of why atmospheric carbon is not a pollutant and why humans cannot regulate it.
The effect of fossil fuel on CO2 emissions is minute, Prof. Salby said. “The fossil fuel perturbation is too small to even be detectable … [It] is presently not detectable. It will not be detectable, ever.”
Science has been taken over by “government bureaucracy under the aegis of the UN.” Its objective, he said in 2016, “has become an exercise in social engineering to predict and control the undetectable.”
Who is Murry Salby?
Murry Salby was critical of anthropogenic global warming. His last position in academia was as a professor at Macquarie University, Sydney, Australia.
According to Wikipedia, in 2013 the university dismissed Prof. Salby on grounds of refusal to teach and misuse of university resources. DeSmog highlighted on Prof. Salby’s profile page that “between 1988 and 2013, Salby committed financial and other offences that led to his departures from faculty positions at two major universities.”
Regarding Macquarie University it appears DeSmog used an in-house report that could not have been accessed without requesting it under the Freedom of Information Act (“FoI”). “DeSmog vaguely suggest there ‘must have been an FoI’, but there are no links to support that. In the end, a confidential, low standard, internal document with legalistic sounding words, may have been ‘leaked’ to those in search of a character attack,” Jo Nova noted.
Prof. Salby’s dismissal from Macquarie University followed a series of unfulfilled commitments by the university, deliberate attempts by the university to sabotage and silence him and a misconduct hearing held by the university while Prof. Salby was in France. As Jo Nova noted at the time: “Is his research is so dangerous to the cash cow that is ‘global warming’ that it had to be stopped at any cost?”
Prof. Salby died in 2022.
Despite the persecution he suffered for going against the climate change narrative, Prof. Salby did not stop speaking out about what he knew to be the truth, as demonstrated by the lecture he gave at University College London in 2016.
During this lecture, Prof. Salby demonstrated why carbon dioxide is not a pollutant as climate change catastrophists claim
Carbon Dioxide is Not a Pollutant
Almost all of the carbon in the atmosphere is in the form of carbon dioxide, Prof. Salby explained. Carbon dioxide cannot be a pollutant, he said, because the combustion of hydrocarbons is a form of oxidation.
Combustion is a type of oxidation reaction because it involves the addition of oxygen to a substance, resulting in the loss of electrons and an increase in oxidation state. In combustion, the fuel reacts with oxygen to produce heat, light and oxidised products, such as carbon dioxide and water.
The plumes of “smoke” you see coming out of towers that are used as the poster child for “climate change” is water vapour, not CO2, Prof. Salby said.
It is also water vapour that you see coming out of car exhausts on a cold morning. And the same process of oxidation powers the human body. In this process, CO2 cannot be produced without simultaneously producing water vapour. CO2 and water are the products of perfect combustion.
Methane, for example, is a simple fuel. In the combustion of methane, for every molecule of CO2 produced, two molecules of water vapour are produced.
Appalachian coal is an example of a more complex fuel. In its combustion, for every three CO2 molecules produced, two molecules of water vapour are produced.
“In regard to climate, whether the ratio of water vapour to CO2 is two to one or two to three really doesn’t matter,” Prof. Salby said. He explained why it doesn’t matter using the opacity of infrared radiation.
Opacity of Infrared Radiation
In his lecture, Prof Salby presented the graph below labelled ‘Greenhouse Heat Trapping Capacity’. It shows the atmosphere’s opacity for the wavelengths of infrared radiation (“IR”) collected over all greenhouse gases.
Opacity refers to the measure of impenetrability to electromagnetic or other kinds of radiation. IR is a type of electromagnetic radiation with wavelengths longer than that of visible light but shorter than microwaves.
In the context of IR radiation, opacity describes the absorption and scattering of IR radiation. The opacity of IR radiation in the atmosphere is influenced by various factors including water vapour, CO2, other gases (such as methane, ozone and nitrous oxide) and temperature.
As Prof. Salby explained, the opacity of IR radiation is “what traps radiant heat at the Earth’s surface. It’s also the premise for the EPA’s finding of ‘endangerment’ by CO2.” The EPA is an acronym for the US Environmental Protection Agency.
In the image above, notice that over almost all wavelengths (horizontal axis) the opacity (vertical axis) is already at the maximum possible of 100% absorption, Prof. Salby pointed out. This is indicated by the area shaded in grey.
The question then is: What atmospheric gases are contributing to the almost 100% opacity of IR radiation?
Prof. Salby placed the contribution CO2 makes to opacity below the total opacity graph, shown in green in the image below. CO2 represents less than 10% of the overall opacity of IR radiation, Prof. Salby said.
He then explained that almost all of the remaining opacity of IR radiation comes from water vapour, as shown in blue in the image below.
“Notice, even at those wavelengths where CO2 absorbs radiation, water vapour absorbs over half of the maximum that’s possible,” Prof. Salby said. “Only what remains – less than half – is influenced by changes of CO2 … [Therefore], the heat-trapping capacity [of water vapour] vastly exceeds the heat-trapping capacity of CO2.”
As stated earlier, in the combustion of hydrocarbons water vapour is produced at the same time as CO2. In other words, water vapour is emitted along with CO2. Add the fact that the heat-trapping capacity of water vapour vastly exceeds the heat-trapping capacity of CO2 (as seen the in image above) and the conclusion can only be as Prof. Salby said: “CO2 will be a pollutant the day that water vapour is a pollutant.”
“It follows that energy sources which circumvent CO2 emission are neither cleaner nor greener, they’re just different,” he added.
What Role Does Fossil Fuel Emission of CO2 Play in Atmospheric CO2
The United Nations Intergovernmental Panel on Climate Change (“IPCC”) takes the simplistic view that all anthropogenic atmospheric CO2 comes from fossil fuels.
What is the reality?
Sharing the graphs in the image below, Prof. Salby explained: “During the decade before the turn of the century, fossil fuel emissions increased almost linearly. During the subsequent decade, it also increased linearly but three times faster.” This increase can be seen in the steepness of the lines in the top graph.
The area under the curve represents the CO2 that was emitted into the atmosphere. “Far more was emitted during the second decade than during the first decade – 200% more,” he said.
“During the same period, atmospheric CO2 also increased linearly,” he said. This can be seen in the second graph.
In the first decade, atmospheric CO2 increased by about 20 parts per million by volume (“ppmv”). During the second decade, unlike fossil fuel emissions, the increase of atmospheric CO2 was virtually identical to the first decade.
“Fossil fuel emission during the second decade was three times that during the first decade. Yet, its impact on the increase of atmospheric CO2 was virtually zero,” Prof. Salby said.
“Where the additional anthropogenic CO2 ended up cannot be said. Where it did not end up [i.e., in the atmosphere] is unambiguous,” he added.
“The premise of the IPCC that increased atmospheric CO2 results principally from fossil fuel emission is impossible,” Prof Salby said. Why?
Because “if fossil fuel emission represented as little as 10% of the increase in atmospheric CO2 the atmospheric increase during the second decade would have been 30% greater than during the first decade – it wasn’t even close,” he explained.
The graphic below of an estimate of the CO2 budget originates from the IPCC. “Of total emission, human emission accounts for only a couple of per cent. The rest – over 95 per cent – comes from natural emission. Even a minor change of natural mission would overshadow human emission,” Prof. Salby said.
IPCC Climate Change Models
Prof. Salby then talked through, in detail, the assumptions and mathematical equations used in climate models to determine the contribution of anthropogenic CO2 to atmospheric CO2.
The principle that underpins it all is conservation law. Conservation law, in physics, is a principle that states that a certain physical property (that is, a measurable quantity) does not change over time within an isolated physical system. In short, what goes in must come out.
The conservation law is closely related to equilibrium. While conservation law ensures that certain physical quantities remain constant over time, equilibrium is a state where the net external force acting on an object or system is zero. In the case of atmospheric CO2, equilibrium is reached when emission equals absorption. If the equilibrium is perturbed by an external force, a new equilibrium will be established.
The problem with global CO2 emissions is we don’t know the global absorption to be able to calculate the rate of emission. However, the IPCC thinks it does, Prof. Salby said.
As seen in the image above, the IPCC believes the global absorption is 150 gigatonnes of carbon. “In truth [the 150 gigatonnes] is a little more than a guestimate. Observations of global absorption do not exist,” he said.
“It should therefore come as no surprise that IPCC estimates of major contributions change by as much as a hundred per cent,” he added.
There is a Way of Determining CO2 Absorption
During the 1950s and 1960s, nuclear bomb tests elevated carbon-14 (“C14”). C14 is a radioactive isotope of carbon that is naturally produced in the upper atmosphere by the interaction of cosmic rays with nitrogen-14 atoms. This process is known as cosmic ray spallation. The produced C14 atoms combine with oxygen to form CO2.
“The nuclear source was removed in 1963 by the nuclear test ban treaty. C14 then decayed through unbalanced absorption,” Prof. Salby explained. By “unbalanced,” Prof. Salby is referring to a perturbance in the equilibrium. “The decay was almost perfectly exponential with an absorption time of just under a decade,” he said.
Comparing this to the absorption of CO2 in the IPCC climate models, “even after 200 years almost 30 per cent of CO2 present initially, remains,” Prof. Salby said and presented the graph below. The blue/green line represents the absorption from nuclear test C14 (decaying to produce CO2) and the pink line represents the absorption according to the IPCC climate models.
Another perturbation, or introduction of unbalanced absorption, is fossil fuels which introduce an anthropogenic component of CO2. “With fossil fuel emission [it is] known … the conservation law completely determines the anthropogenic component,” Prof. Salby said.
The slowest absorption determines the “upper bound.” This slowest absorption is the decay of C14 which is 10 years.
Observation of CO2 in the free atmosphere began in 1960.“ An upper bound follows by presuming that for all years before 1960, fossil fuel emission was equal to its maximum – namely, the fossil fuel emission in 1960. Recall, the perturbation never exceeds its equilibrium level.”
From this Prof. Salby was able to calculate the upper limit of anthropogenic CO2 in 1960 (10 ppmv) and its proportion of the total atmospheric CO2 (24%). Using this as a baseline, Prof. Salby calculated that the upper limit of anthropogenic CO2 over the last 50 years increased by approximately 20 ppmv, 28% of the total increase in atmospheric CO2.
What Effect Does the Increase in Anthropogenic CO2 Have on Temperature?
Prof. Salby then used this upper limit of 28% to estimate the increase in temperature due to anthropogenic CO2. This is where the opacity of IR radiation becomes relevant.
The opacity at most wavelengths is already saturated, at 100%, and the collective opacity has plateaued at 75%, Prof. Salby explained. Increasing CO2 to 280 ppmv adds only 6% to opacity and increasing CO2 further to 400 ppmv adds only another half a per cent, he said. “As we’ve seen, less than 30% [28%] of that increase is the fossil fuel perturbation. It introduces a temperature perturbation of less than a tenth of a degree [Celsius].”
“The projected life for fossil fuel reserves is about 100 years. At the current growth of CO2, the opacity then will have increased by another 1%. Even then, the fossil fuel perturbation represents less than 40 per cent of the increase – it introduces an additional temperature perturbation of less than three-tenths of a degree,” he said. “The cumulative fossil fuel perturbation [over the 100 years] is less than half a degree.”
“The range of natural variability [in temperature] is half a degree to one degree. That’s considerably larger than the fossil fuel perturbation,” Prof. Salby said. “Without major amplification through feedback, the fossil-fuel perturbation is not even detectable. It’s smaller than the noise of natural variability.”
All of the above is an upper bound, the upper limit, which means the effects of fossil fuel cannot be greater. It can, however, be smaller. And as it turns out, it is, said Prof. Salby.
A More Definitive Treatment of CO2 Absorption
A disturbance or perturbation to CO2 emission is temporarily introduced and then removed from a system. This temporary nature of perturbations allows for a more definitive calculation of CO2 absorption.
CO2 is perturbed by changes in temperature which modulates CO2’s emission. Perturbation in emission is proportional to the perturbation in temperature. And so, changes in temperature will produce proportional changes in CO2. Although, there is a time lag between CO2 changes and the temperature change. Changes in CO2 lag behind temperature changes.
Nature provides perturbations that allow scientists to study this lag and the effect temperature has on CO2 emission. Annual disturbances such as El Niño, La Niña and volcanic eruptions perturb global temperature, which perturbs CO2 emission. Using these events to establish the lag of CO2 emission behind temperature, the absorption time of CO2 can be determined. Using observation of these events, the absorption time has been calculated as 9 months.
“That’s 10 times faster than what’s apparent in the decay of carbon-14,” Prof. Salby said. How can that be?
The short answer, he said, is that “carbon-14 lied, but not intentionally.” It is presumed that when elevated C14 was taken out of the atmosphere, it stayed out of the atmosphere. “That is impossible,” he said and, although we haven’t noted the details here, explained why it was impossible.
“With an absorption time of less than a year [9 months], the anthropogenic fraction of increased CO2 isn’t just smaller than 30% – it’s smaller than 3%,” he said.
Natural Fluctuations in CO2
“During an interval of eight months from September to May, CO2 increases by 7.5 ppmv. During the subsequent interval of four months, CO2 then decreases by about 6 ppmv,” Prof. Salby explained. Noting that the sole reason CO2 decreases in those four months is due to unbalanced absorption.
“Each year CO2 goes up five steps of 1.5 ppmv, then down four steps. Five steps up, four steps down … notice the residual after each cycle is 1.6 ppmv. Ring a bell? It’s identical to the trend of CO2,” he said.
This annual step-up-step-down CO2 cycle, where 80% of the CO2 perturbation is absorbed in four months, shows that the absorption time of CO2 is less than the 9 months as calculated using the CO2 lag behind temperature method. Using the annual CO2 cycle, the annual mean absorption time for CO2 is calculated as 7.5 months.
How Much of the Annual Increase in CO2 is Due to Fossil Fuels?
Each year, total CO2 increases by 1.6 ppmv. Of that, 0.1 ppmv is due to anthropogenic emission. “At only 0.1 ppmv per year, additional anthropogenic emission is eclipsed by additional total emission,” Prof. Salby said.
He used various methods to calculate the proportion of anthropogenic CO2 emissions in the total increase in CO2 emission since 1960. They all came out at less than 3% (between 1.3% and 2.8%). The IPCC assumes that all anthropogenic CO2 emissions come from fossil fuels. Based on this assumption, it means that fossil fuel emission contributes less than 3% to the increase in CO2 emission.
“The fossil fuel perturbation is minute,” Prof. Salby said. “The fossil fuel perturbation is too small to even be detectable … [It] is presently not detectable. It will not be detectable, ever.”
Speaking of the dramatic language relating to fossil fuel emissions used by advocates of the climate change agenda Prof Salby said: “Never has so much been claimed on the premise of so little.”
Below, we have embedded Prof. Salby’s presentation to begin at the final 10 minutes where he starts his conclusion. If you are unable to watch his full presentation, these 10 minutes are well worth hearing. He speaks about the subversion of science by “government bureaucracy under the aegis of the UN.” Its objective, he said in 2016, “has become an exercise in social engineering to predict and control the undetectable.”
Prof Murry Salby Lecture: ‘Atmospheric Carbon’, 18 July 2016 (85 mins)
この記事が気に入ったらサポートをしてみませんか?