ChatGPT 4o と TikZ-Feynman でファインマンダイアグラムを描く


セミナーのスライドを作っていて、こういうファインマンダイアグラムを描きたくなったのですが、対応する座標の値を見積もって TikZ で微調整しながら描くのは面倒です。せっかくなので、手描きの雑ダイアグラムを ChatGPT 4o に放り込んで描いてみましょう。(こういう場合に GUI のアプリケーションがあると便利ですね。数年前までこういう図を書くときには jaxodraw を用いていましたが、最近の mac OS だと挙動が怪しい気がするので使わなくなりました。jar ファイルの中身を覗くというライフハックでしばらく使えていたんですが……)

あまり複雑な内容から始めると埒が明かなくなるのは目に見えているので、ファインマンダイアグラムからいったん離れて上のような樹形図から始めようとしましたが上手くいかず、もう一手戻って

樹形図の頂点情報だけを抜き出した上の画像から始めることにします。適当なプロンプトで座標の情報を教えてもらいます。
In the uploaded image, there are 14 black dots. Defining the coordinate system by taking the horizontal and vertical directions as axes, tell me the coordinates of these 14 black dots.

I'll analyze the image to identify the coordinates of the black dots. Let's process the image to find the coordinates of these dots.
The coordinates of the 14 black dots in the image are:
1. (634, 417)
2. (544, 451)
3. (709, 478)
4. (868, 497)
5. (761, 519)
6. (917, 555)
7. (550, 589)
8. (644, 603)
9. (819, 603)
10. (914, 629)
11. (752, 686)
12. (501, 692)
13. (388, 831)
14. (251, 884)
These coordinates are defined in the image with the horizontal and vertical directions as the axes.
なんとなく上手くいっていそうなので、TikZ で描いてもらってチェックします。
Sounds good! Then, could you tell me the latex source code to draw these points using the TikZ package?
出力されるソースコードも完璧ですが、いくつか不満があるので改善してもらいます。
Nice! Could you improve the following two points?
1. The sign of the y coordinate should be flipped to correct the vertical direction.
2. Save each coordinate information in a separate variable to be used later for further drawing.
最初のポイントは、ゲームを作ったことがある人なら誰しもがハマる罠、「原点が左上で y 軸は下向き」を修正するためのものですね。
Certainly! Here is the improved LaTeX source code that flips the y coordinates and saves each coordinate in a separate variable:
``` latex
\documentclass{standalone}
\usepackage{tikz}
\begin{document}
\begin{tikzpicture}
% Define the coordinates
\coordinate (A) at (6.34, -4.17);
\coordinate (B) at (5.44, -4.51);
\coordinate (C) at (7.09, -4.78);
\coordinate (D) at (8.68, -4.97);
\coordinate (E) at (7.61, -5.19);
\coordinate (F) at (9.17, -5.55);
\coordinate (G) at (5.50, -5.89);
\coordinate (H) at (6.44, -6.03);
\coordinate (I) at (8.19, -6.03);
\coordinate (J) at (9.14, -6.29);
\coordinate (K) at (7.52, -6.86);
\coordinate (L) at (5.01, -6.92);
\coordinate (M) at (3.88, -8.31);
\coordinate (N) at (2.51, -8.84);
% Draw the points
\fill (A) circle (2pt);
\fill (B) circle (2pt);
\fill (C) circle (2pt);
\fill (D) circle (2pt);
\fill (E) circle (2pt);
\fill (F) circle (2pt);
\fill (G) circle (2pt);
\fill (H) circle (2pt);
\fill (I) circle (2pt);
\fill (J) circle (2pt);
\fill (K) circle (2pt);
\fill (L) circle (2pt);
\fill (M) circle (2pt);
\fill (N) circle (2pt);
\end{tikzpicture}
\end{document}
```
This code flips the y-coordinates and saves each coordinate in a separate variable for further use in your TikZ drawing.

とても良さそうです。ここまでで必要な座標の情報は抜き出せているので、あとはそれを使って TikZ コードを組めば良いところですが、せっかくなので続きの作業も ChatGPT に頼ってみます。というより、TikZ の知識がないので頼る必要がありました。とりあえず、座標と図の点の対応関係がわかりにくいので、図にラベルを貼ってもらうことにします。
Very good! It is now a bit difficult to identify which point on the image corresponds to a specific coordinate variable. Could you label all the points with the coordinate names?

これでどこに線を引いてもらうべきかは明らかです。
Perfect! Now I would like to connect these points with line segments, making a tree diagram. Please connect these pairs of points.
N - M
M - K
M - L
K - J
K - I
I - F
I - D
L - H
L - G
H - E
H - C
G - A
G - B

おっといけない、忘れていました。本当に欲しいのは樹形図ではなくてファインマンダイアグラムです。……という小芝居は置いておいて、このように後出しで少しずつ情報を与えると ChatGPT は比較的良く答えてくれる、気がします。
In fact, I would like to write a Feynman diagram using the tikz-feynman package, instead of a tree diagram. Among the line segments you drew, those connecting K - I, I - F, I - D, M - L, H - C, G - B, are gluon lines, while all the others are fermion lines. Could you modify the source code to realize this?
かなりいい感じになりますが、こうなるともう頂点の黒丸とラベルは邪魔なので消してもらいます。
All right, now I do not need the black dots or labels anymore. Could you erase them for me?
最後に、フェルミオンの矢印が一部逆を向いていることに気づいたので修正します。
Very good! Finally, some of the fermion lines have wrong arrows. Could you flip the direction of arrows of the segments L - G and G - A?
Certainly! Here is the updated LaTeX source code with the arrows of the segments \( L \) - \( G \) and \( G \) - \( A \) flipped:
```latex
\documentclass{standalone}
\usepackage{tikz}
\usepackage{tikz-feynman}
\begin{document}
\begin{tikzpicture}
% Use tikz-feynman for Feynman diagrams
\begin{feynman}
% Define the coordinates
\coordinate (A) at (6.34, -4.17);
\coordinate (B) at (5.44, -4.51);
\coordinate (C) at (7.09, -4.78);
\coordinate (D) at (8.68, -4.97);
\coordinate (E) at (7.61, -5.19);
\coordinate (F) at (9.17, -5.55);
\coordinate (G) at (5.50, -5.89);
\coordinate (H) at (6.44, -6.03);
\coordinate (I) at (8.19, -6.03);
\coordinate (J) at (9.14, -6.29);
\coordinate (K) at (7.52, -6.86);
\coordinate (L) at (5.01, -6.92);
\coordinate (M) at (3.88, -8.31);
\coordinate (N) at (2.51, -8.84);
% Draw the fermion and gluon lines
\diagram* {
(N) -- [fermion] (M),
(M) -- [fermion] (K),
(M) -- [gluon] (L),
(K) -- [gluon] (I),
(K) -- [fermion] (J),
(I) -- [gluon] (F),
(I) -- [gluon] (D),
(L) -- [fermion] (H),
(G) -- [fermion] (L), % Flipped direction
(H) -- [fermion] (E),
(H) -- [gluon] (C),
(A) -- [fermion] (G), % Flipped direction
(G) -- [gluon] (B)
};
\end{feynman}
\end{tikzpicture}
\end{document}
```
In this version, the arrows of the segments \( L \) - \( G \) and \( G \) - \( A \) have been flipped to correctly represent the direction of the fermion lines.
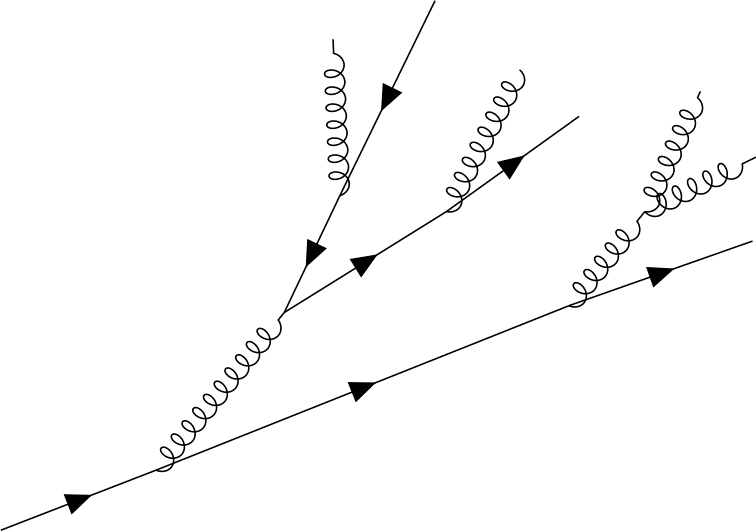
ということで完成です、おつかれさまでした!
この記事が気に入ったらサポートをしてみませんか?