
Understanding Join, Relationship and Data Blend(Blending) of Tableau

*Revised on November 2, 2022
Introduction
Hello.
As many of you may know, Tableau Version 2020.2 adds a New Data Modeling feature called “relationships”.
Tableau's help page on web explains this "relationship". However, to be honest, it is a little bit difficult to understand only with that.
In this article, I would like to talk about this "relationship" and re-associate Tableau’s data connections
・Join
・Relationships
・data blend (blending)
I will try to organize the behaviors and characteristics of these.
Relationships are different from join and data blending.
We will use sample data to verify the differences.
The workbook used in this article is published on Tableau Public.
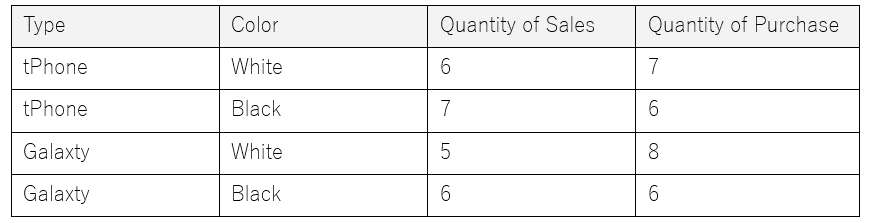
The sample data is data of a used mobile phone shop in a town, called "Sample Super Mobile".

We have two types of mobile phones "tPhone" and "Galaxty".
Both mobile phone types are available in white color and black color.
As it is a used shop, mobile phones are sold and purchased.
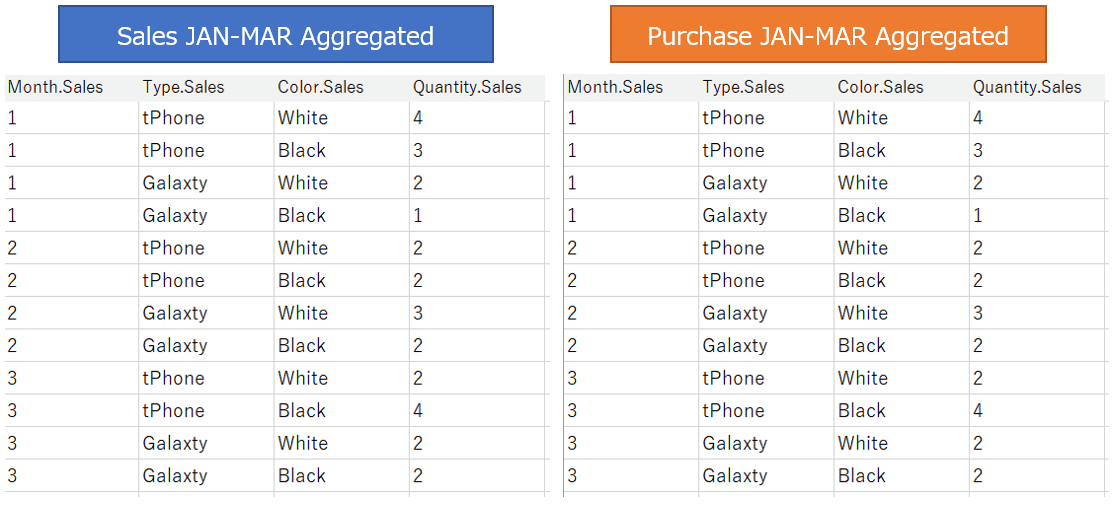
Case 1
Joining aggregated data
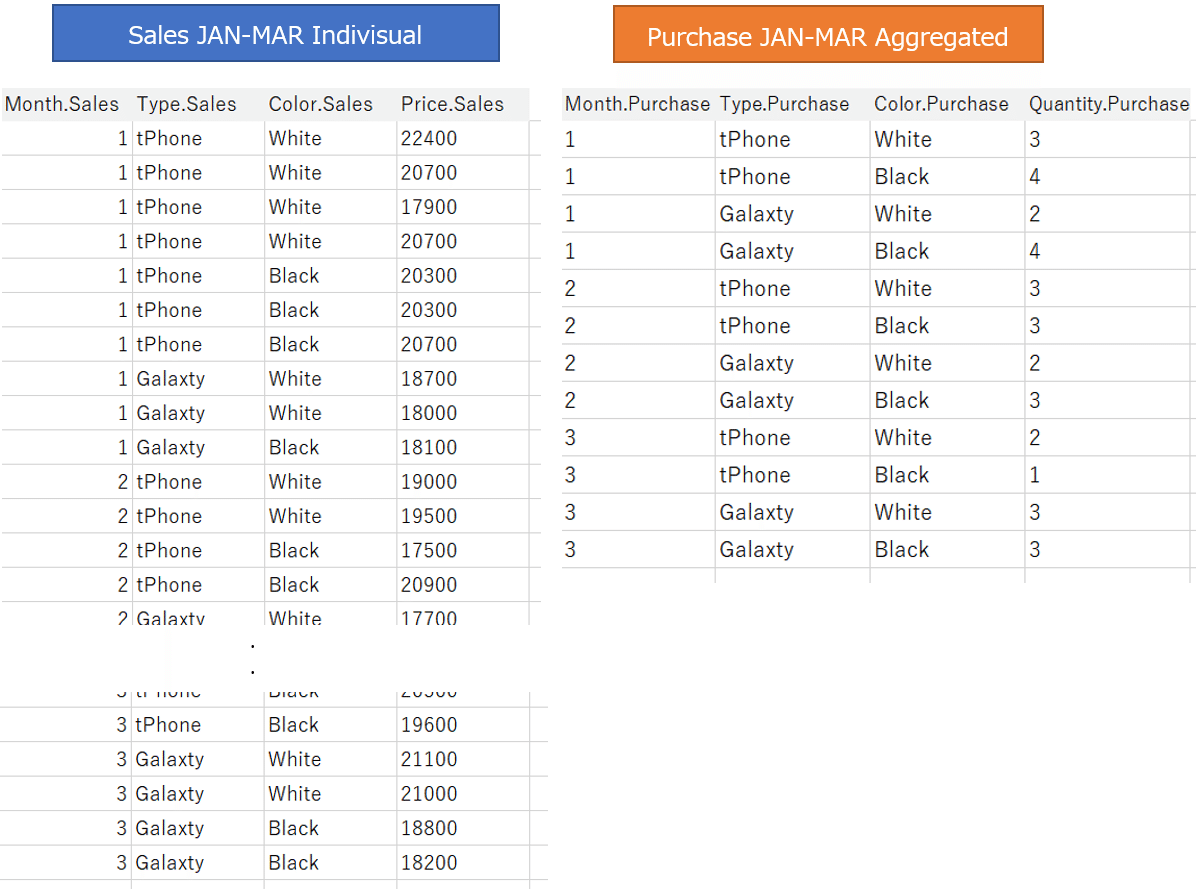
The first sample data is sales and purchase data from January to March.
Both of sales and purchases data are aggregated by Month, Type, and Color.
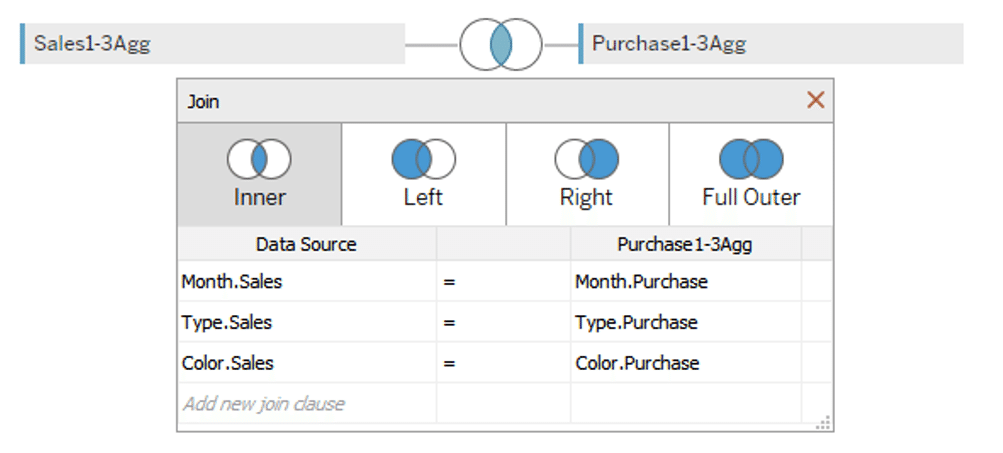
Connect to these two data tables from Tableau.
There are several ways to handle both data tables in Tableau.
At first, try a simple join.
We joined (inner join) two data tables with join keys (Month, Type, and Color).
As a result, each row in both data tables corresponds to one to one, resulting in the data source shown below.
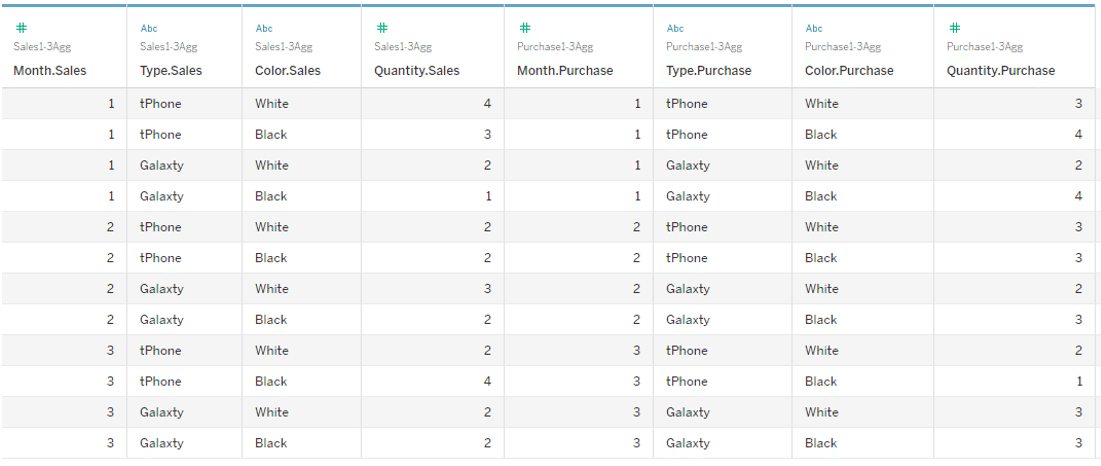
With this data source,
we visualize sales quantity and purchase quantity by Month, Type and Color.
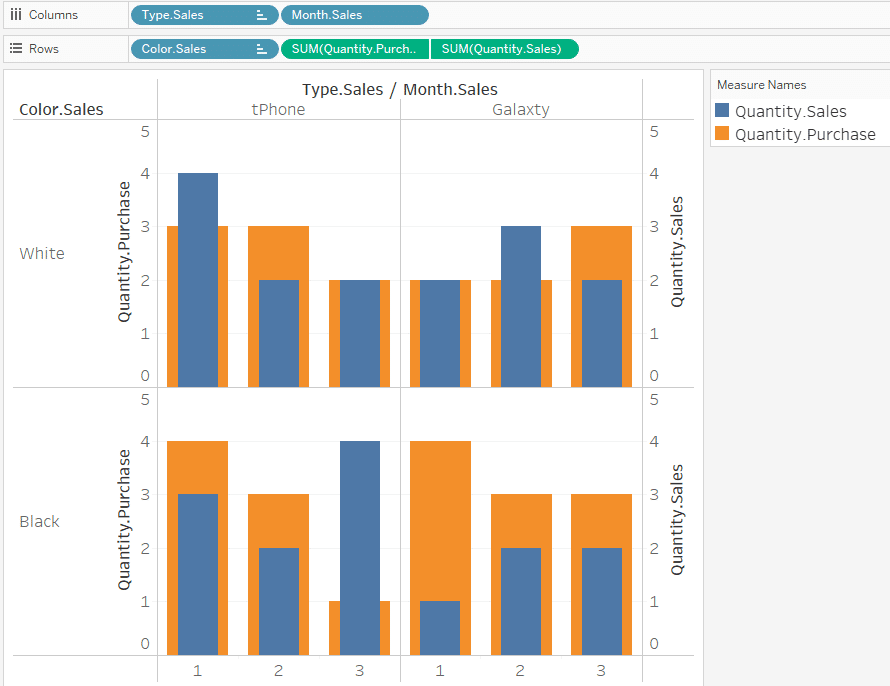
The double axis overlaps the total quantity sold and the total quantity purchased. Blue is quantity sold. Orange is the quantity purchased.
This seems to be all right.
Case 2
Joining individual transaction data with aggregated data
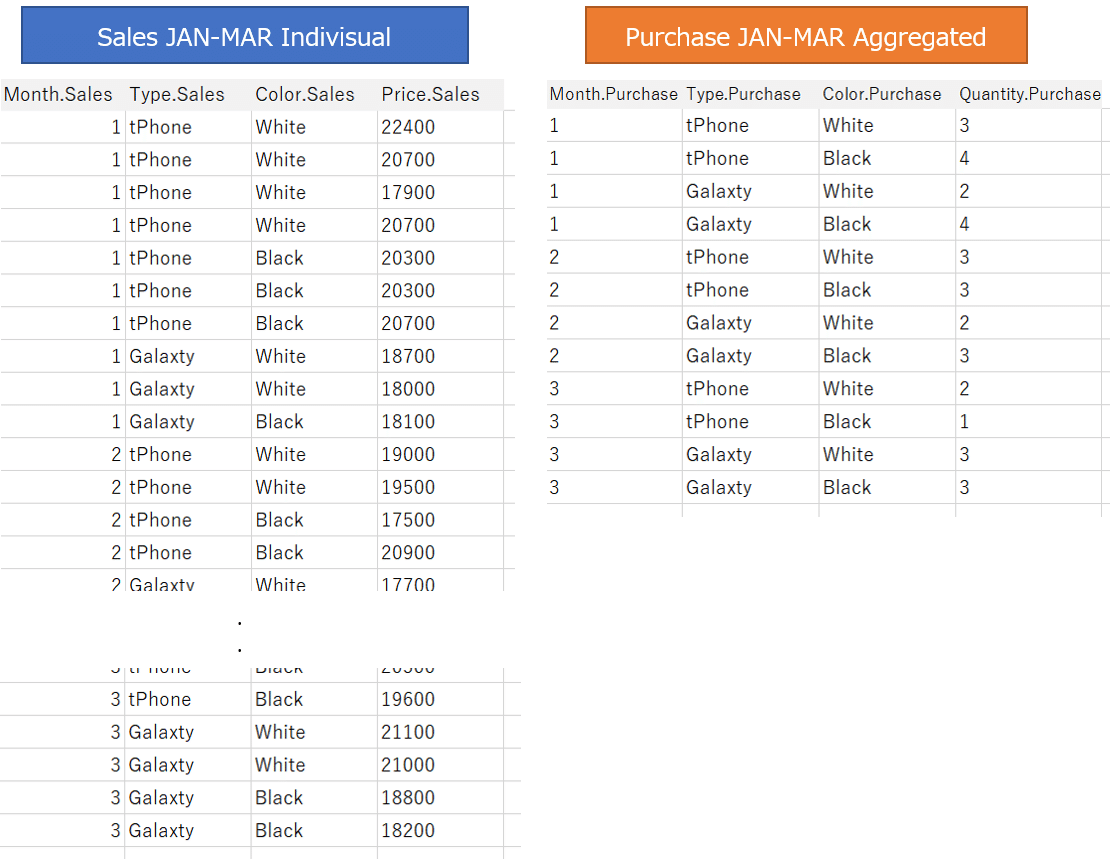
Next, we would like to consider other sample data.
Data for the same period at the same used mobile phone shop as Case 1.
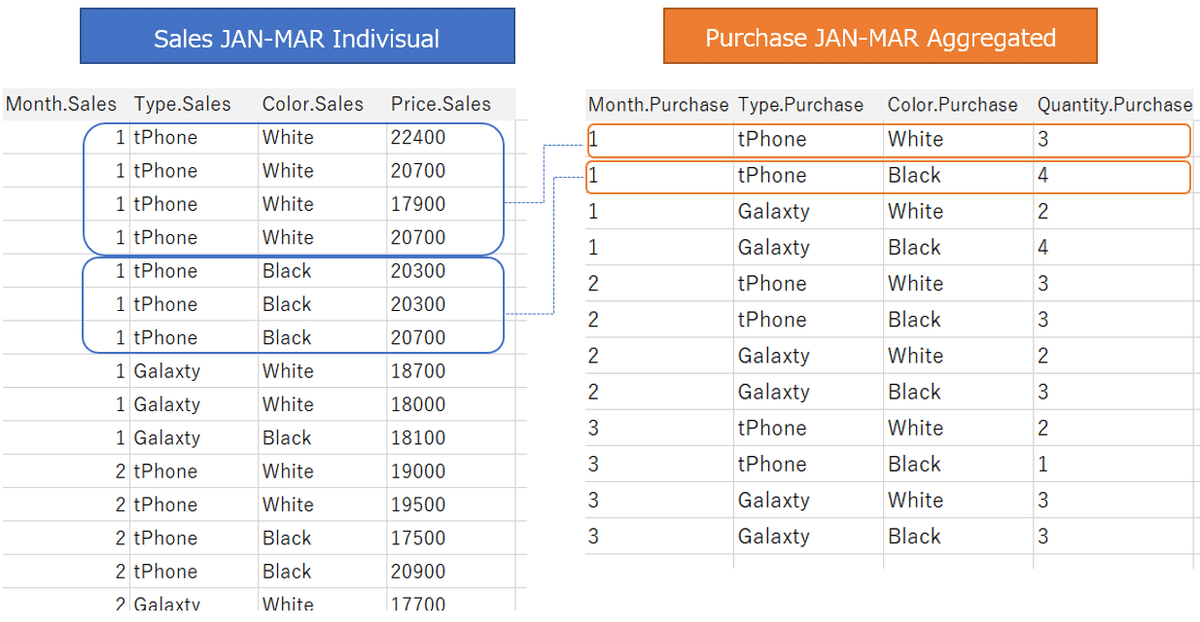
However, the sales data for this time is not aggregated, but each sales data is recorded as an individual record.
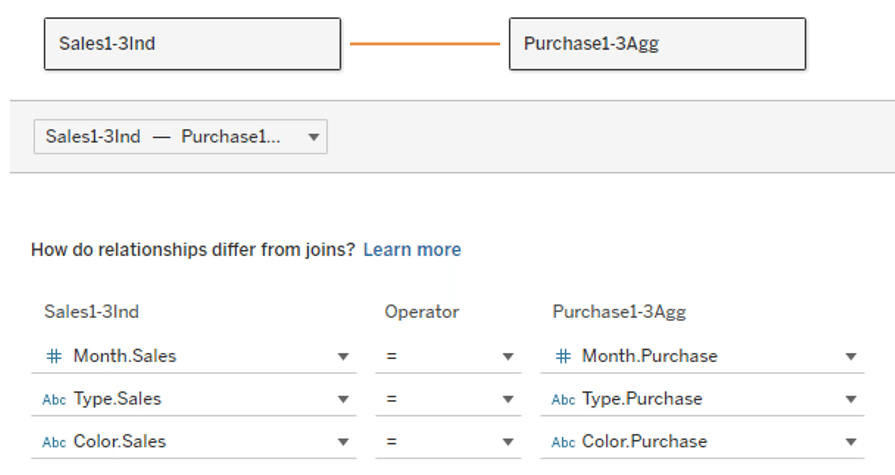
Try joining (inner join) these two data tables with keys (Month, Type, and Color).
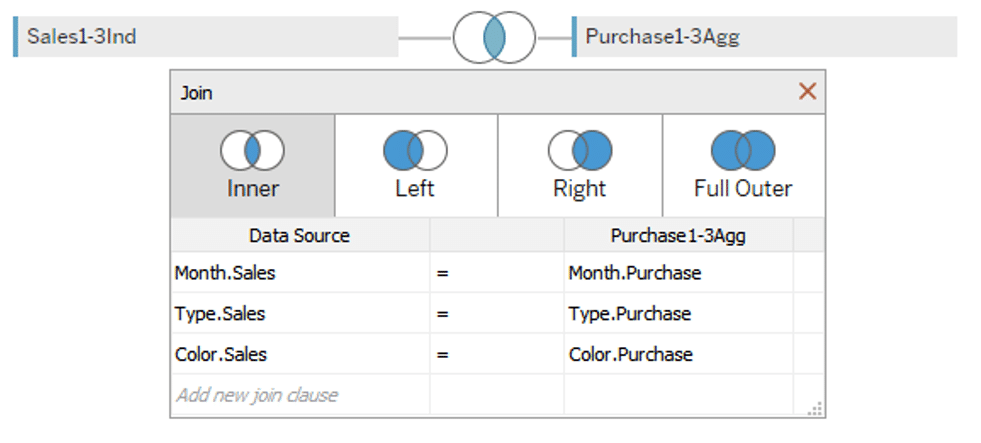
As in this case, if you join data from individual transactions on one side and data aggregated at a coarse granularity on the other side, all the records in the aggregated data correspond to each row of individual transaction data (many-to-one), and the records in the aggregated data are duplicated. (Figure below)
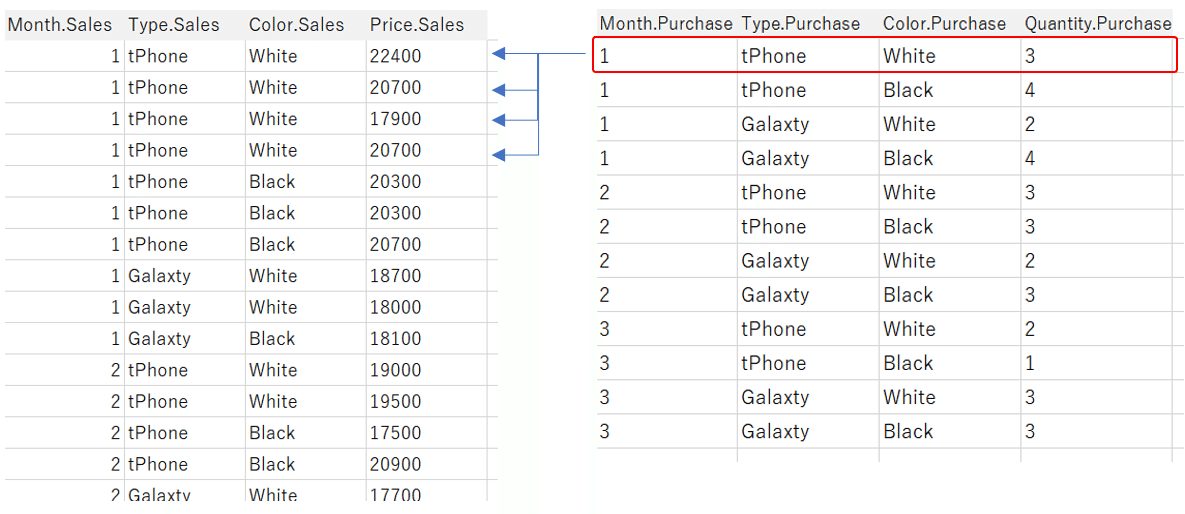
As a result,
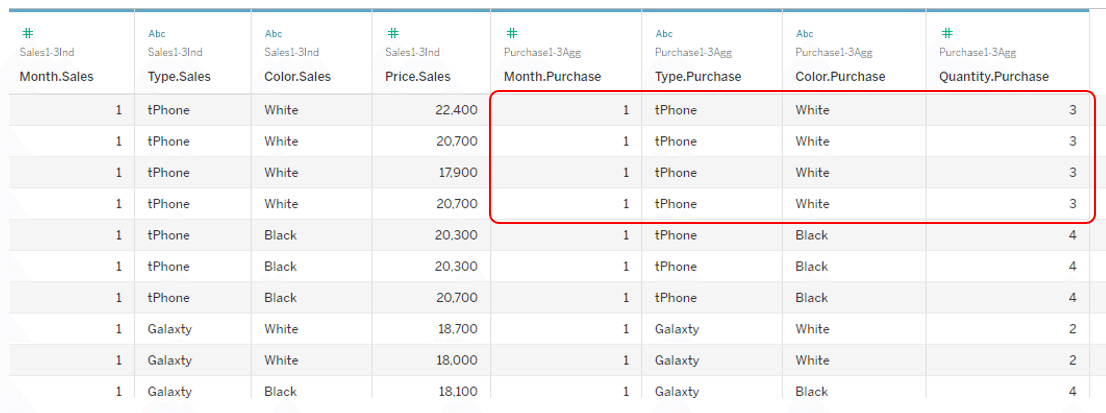
As shown in this red frame above, the records on the aggregated data are duplicated.
With this data source:
When we visualize sales quantity and purchase quantity by Month, Type and Color, If you add up the [Quantity.Purchase]
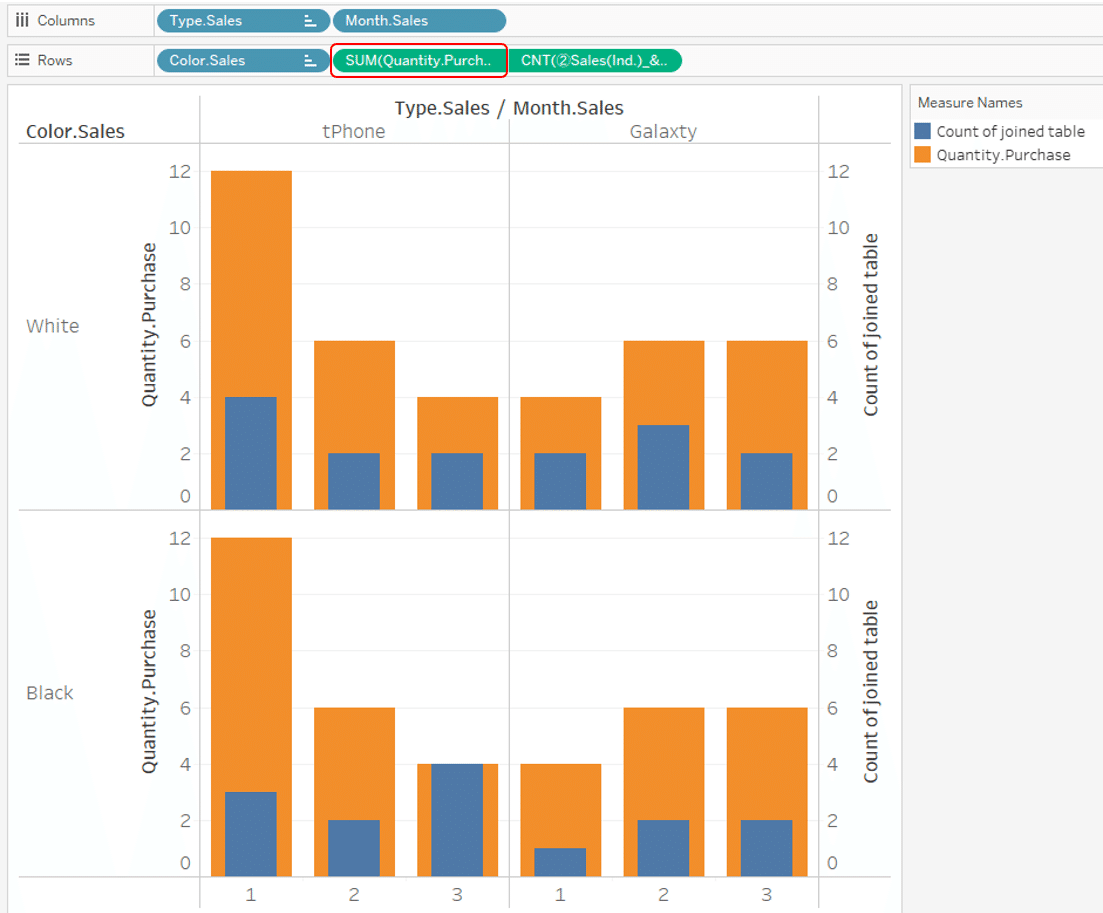
As above, the total purchase data is duplicated, so it becomes a large number.
To solve this problem, it is necessary to take into consideration such as applying the aggregation method of [Quantity.Purchase] as a minimum value. (Figure below)
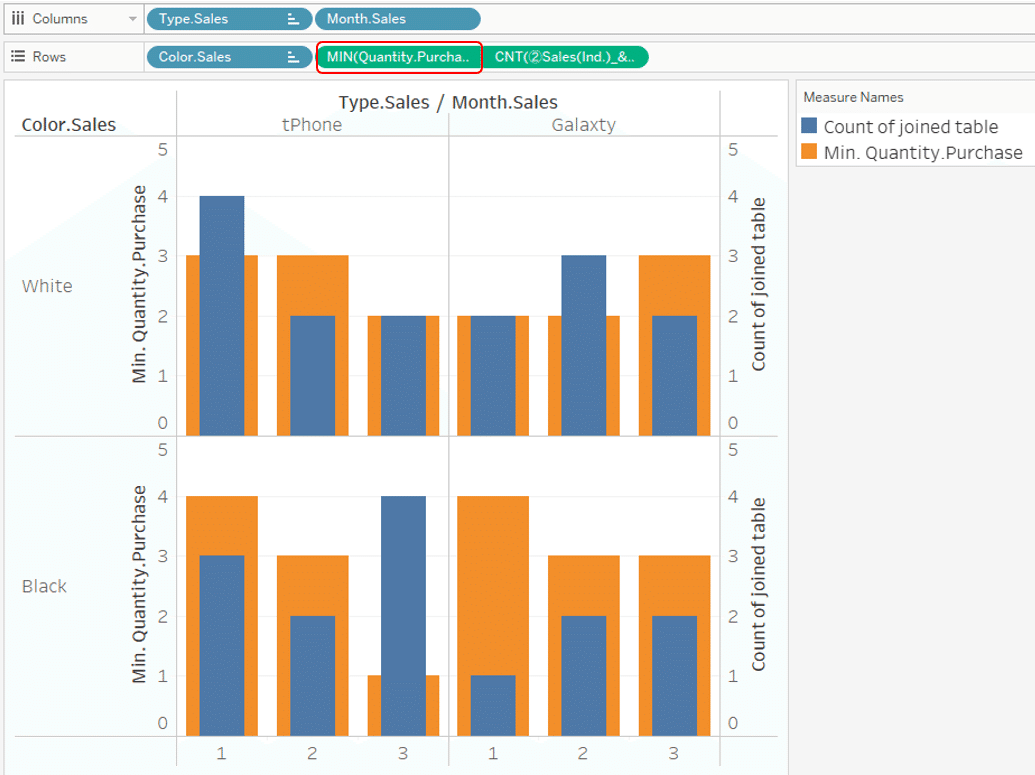
You can see that join is row-level association.
Let's try relationships instead of join in the following case.
Case 3
Relationships between individual transaction data and aggregated data
Same as case 2,
sales data is data for individual transactions, and purchase data is aggregated.
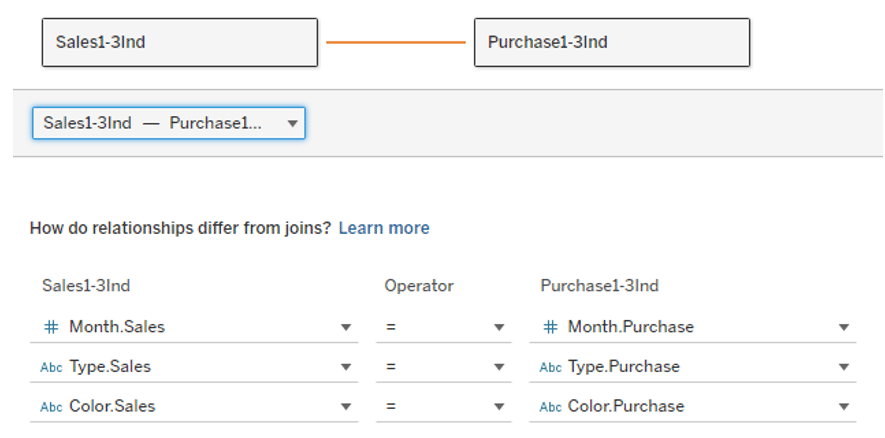
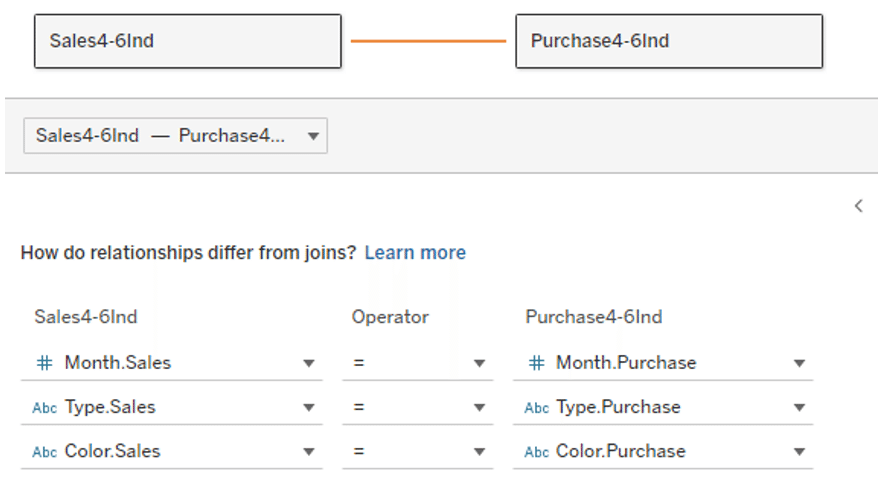
Now set up a relationship with these two data tables, with Month, Type, and Color as keys.
*This "key" fields are called as “related fields" on some web sites. For the purposes of this article, the term "key" is used.
Relationships prevent data from being duplicated, as in Case 2.
In the image, the two tables coexist in the data source without actually sticking the data tables together, making the areas where the keyed fields match relevant. (Image below)
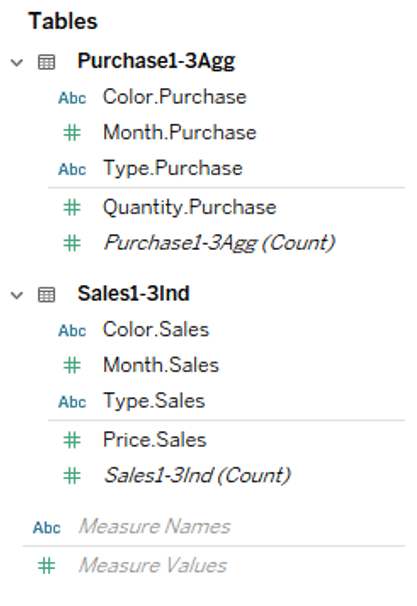
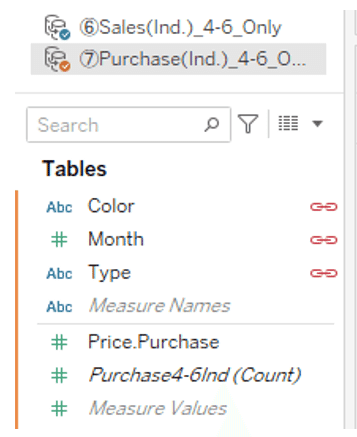
The data pane is as following image.
When the data in both data tables is used in Viz, this association works and Viz is created using the aggregate values in each range.
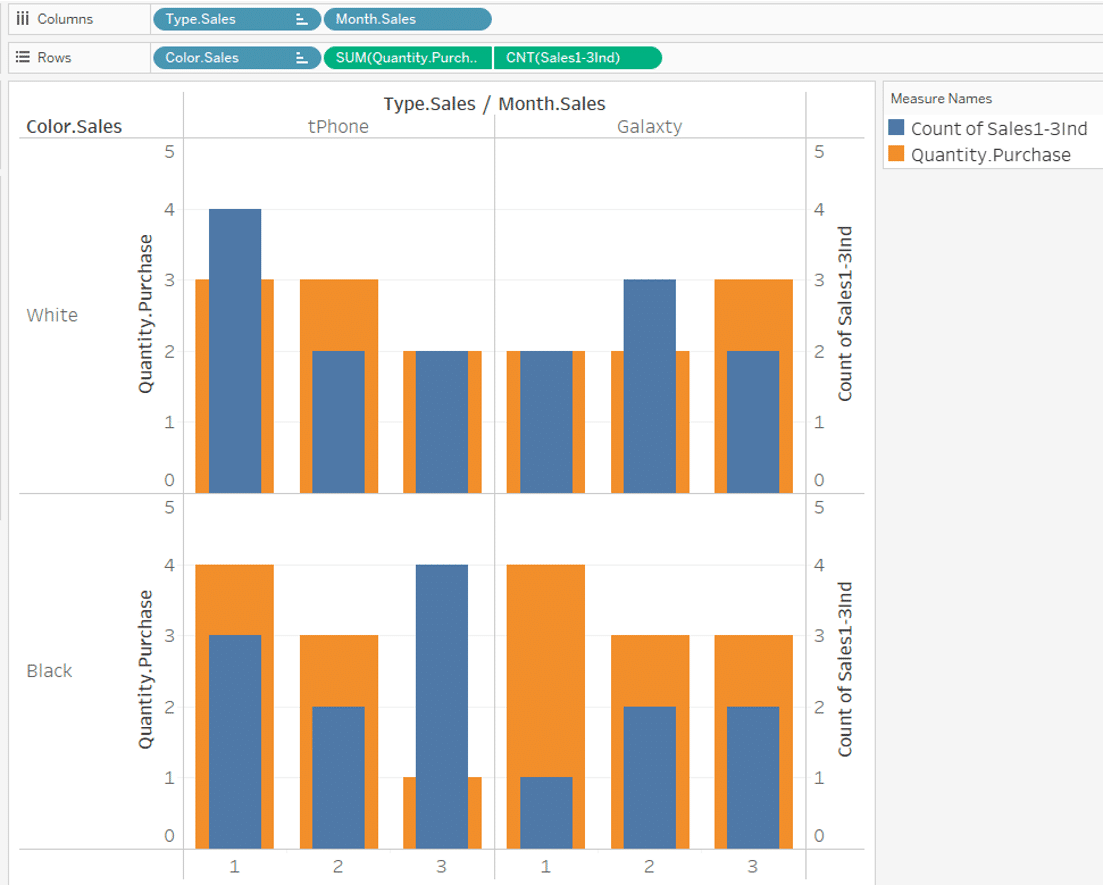
Same as before, we try to visualize sales quantities and purchase quantities, by Month, Type and Color.
Even if we use sum of the aggregated data [Quantity.Purchase], the result is the correct number.
*Addendum
For Month, Type and Color fields on the column and row shelves, the result will be the same whether you use the filed from the sales table or the purchase table.
Case 4
Relationships between individual transaction data
As a further example of a relationship, let's look at an example where both sales and purchase data are individual transaction data.
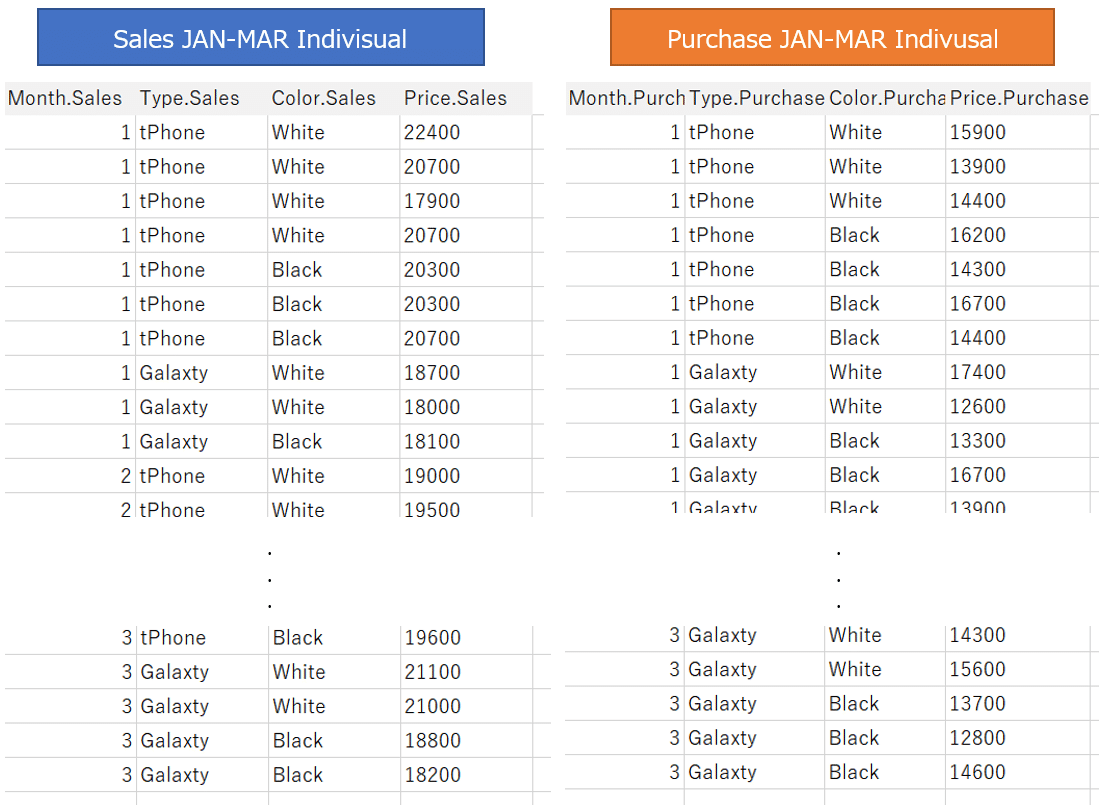
If you join these two data tables, all the key matching rows in each other's tables will be matched and duplicated, and they will grow tremendously.
Before introduction of relationships, data blending was the best practice in such cases, but now relationships are the usable.
Again, set up a relationship with the data table, with Month, Type, and Color as keys.
Also in this case, the data tables do not stick together, but coexist in a relationship between ranges of matching keys.(Image following)
With this data source:
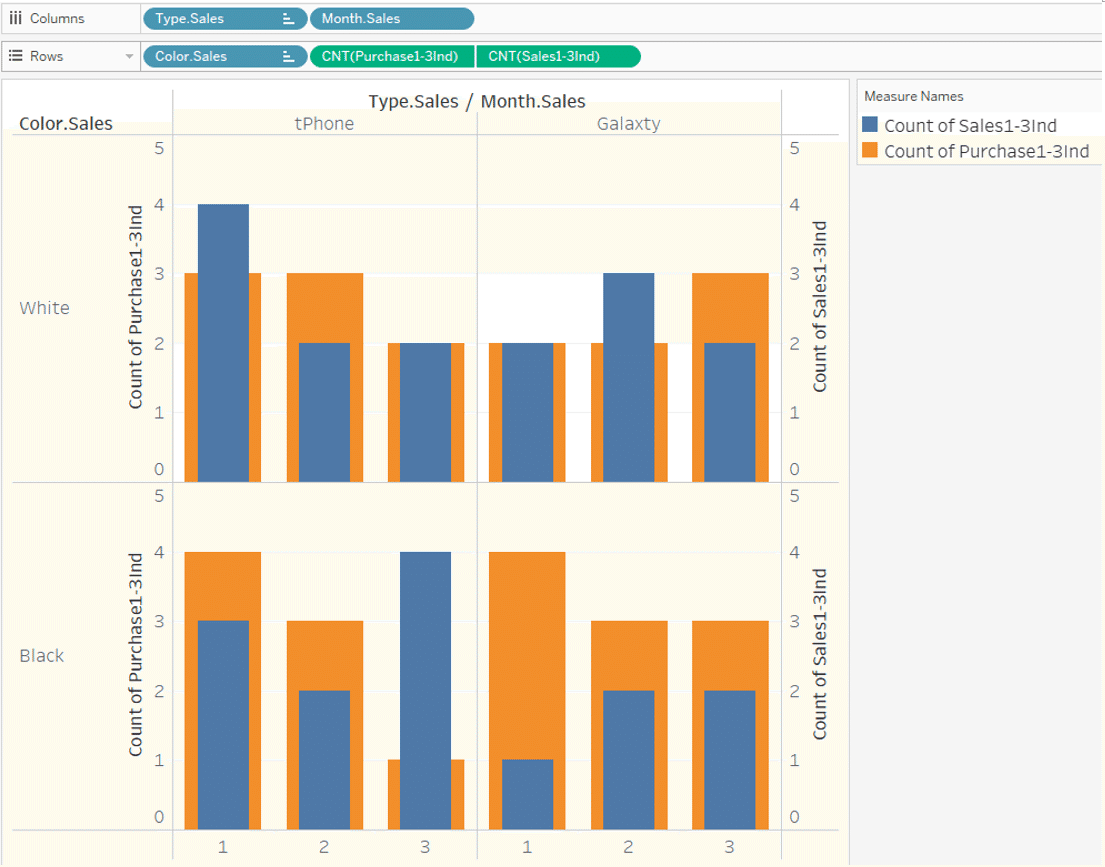
When you visualize sales quantity and purchase quantity, by Month, Type and Color,
even if you count by count as shown in the figure below, the record is not duplicated, and the correct number is displayed.
If you want to compare the total sales price with the total purchase price instead of the quantity,
you can use SUM ([Price.Sales]) and SUM ([Price.Purchase]).
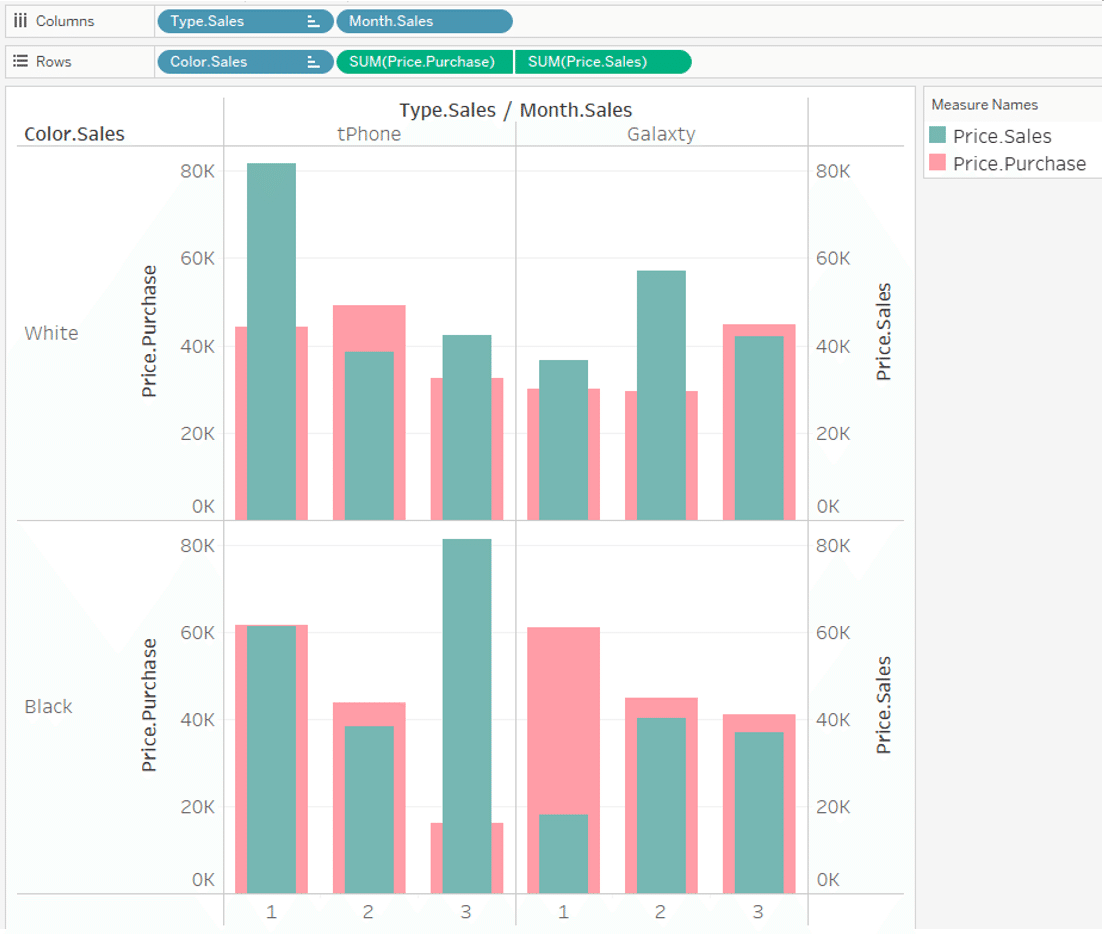
In this way, it aggregates properly in each range and displays it on Viz.
If you describe a join as a “row-level association”,
personally, I would like to describe relationships as "range-level association".
Here are some of the behaviors associated with equations and relationships.
①
The first is a consolidation calculation across two data tables.
We made a formula of total selling price minus total purchase price
SUM ([Price.Sales]) - SUM ([Price.Purchase])
and displayed it on Viz.
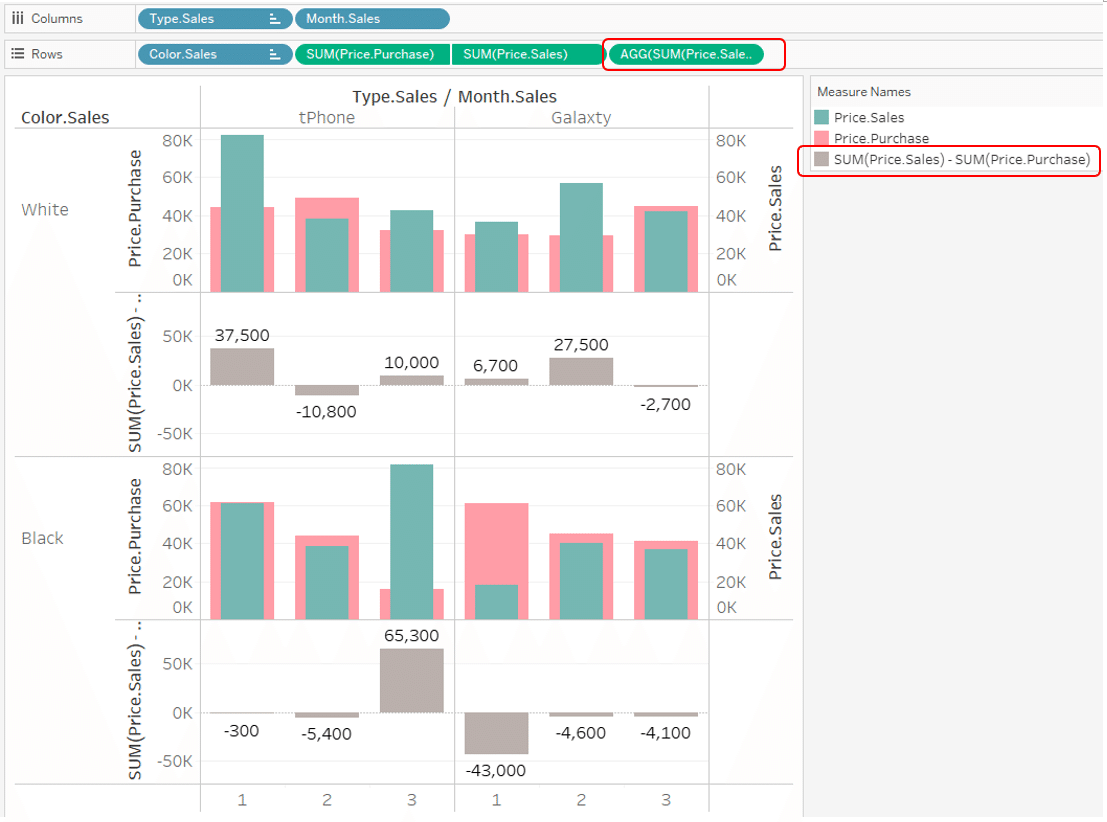
In this case, looking "White of tPhone in January" for example.
SUM calculations are done for each of the tables.
And subtraction is done after that.
We are getting the desired results.
②
Next, we made row-level calculation
[Price.Sales] - [Price.Purchase]
And, we added this up and put it on Viz.
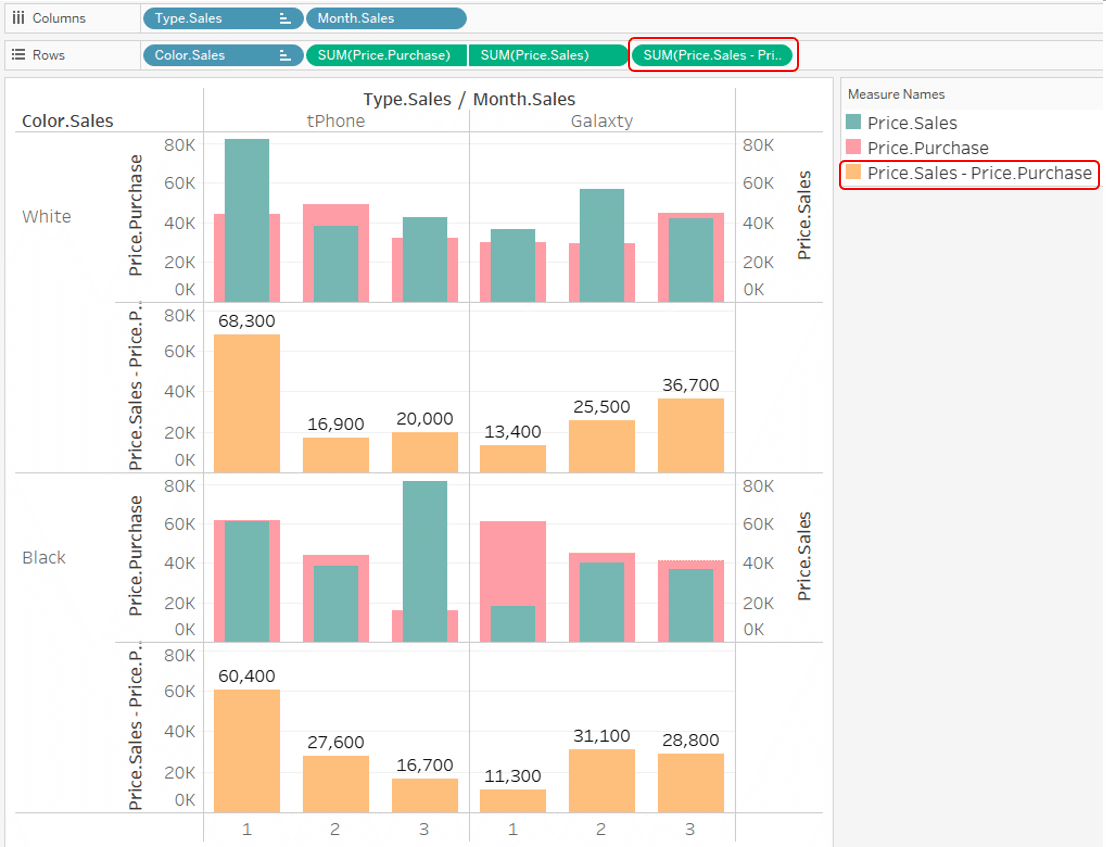
This
[Price.Sales] - [Price.Purchase]
is a row-level calculation.
[Price.Sales] and [Price.Purchase] are on the sales table and the purchase table that set up a relationship.
In which row and row combination is this row-level formula calculated?
The correct answer is all the combinations associated with the key.
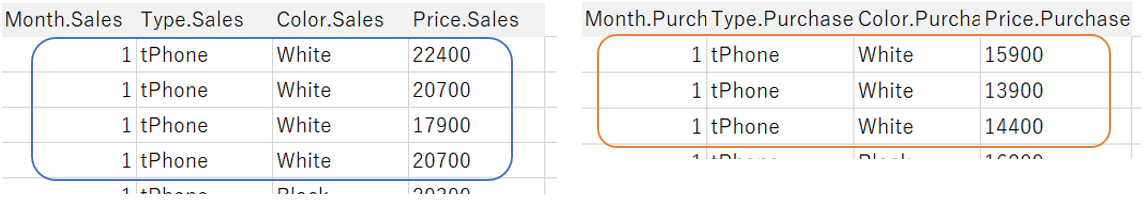
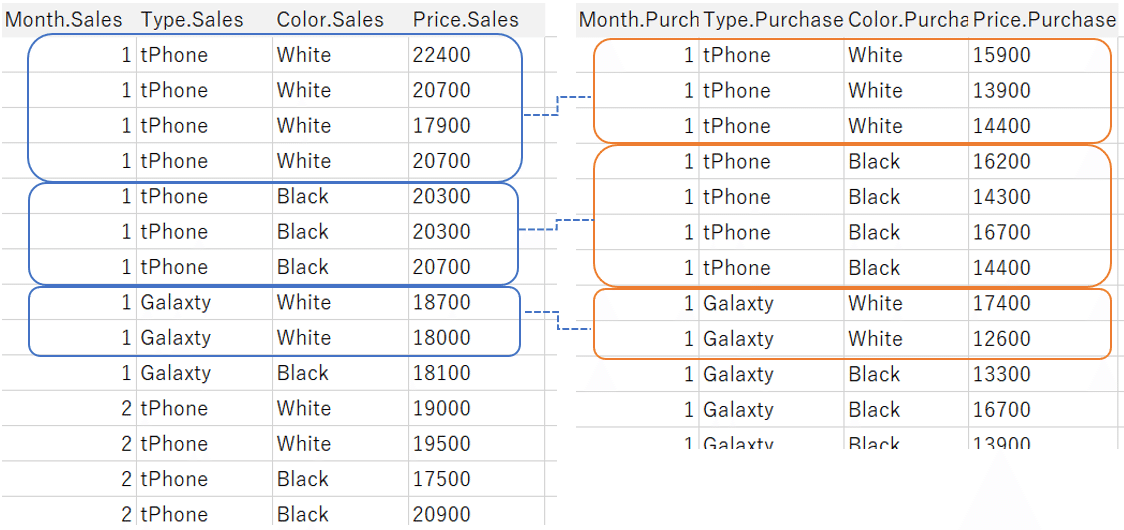
Looking "White on tPhone in January" for example,
in a combination of all four rows of the sales table and all three rows of the purchase table,
there are 12 possible combinations for [Price.Sales] - [Price.Purchase]
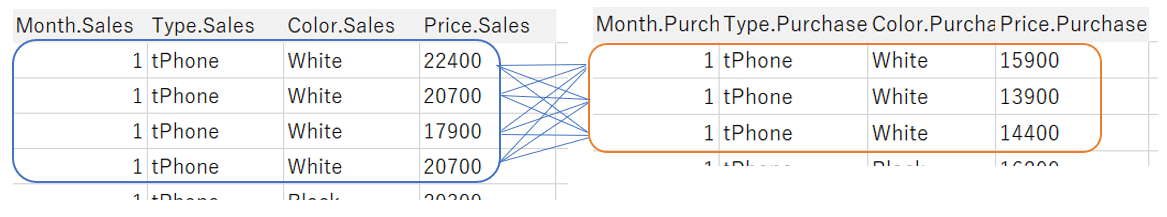
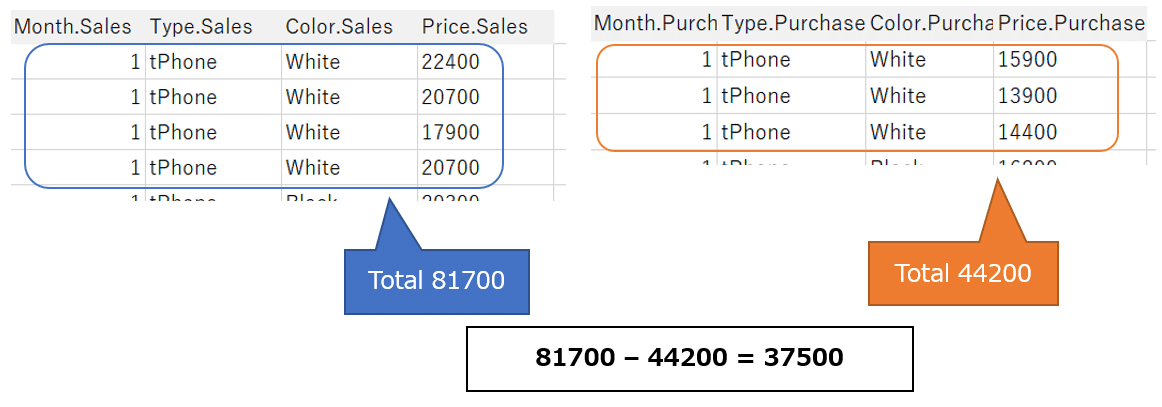
Viz shows 68,300 "January white tPhone"
It is the sum of these 12 calculation results.
22400-15900 + 20700-15900 + 17900-15900 + 20700-15900
22400-13900 + 20700-13900 + 17900-13900 + 20700-13900
22400-14400 + 20700-14400 + 17900-14400 + 20700-14400
=68300
The 12 possible combinations that perform this calculation are like row-level join. In other words, if you make a row-level calculation that spans multiple tables in a relationship, the behavior is the same as if the tables were joined together (inner join).
In this way, relationships can change the way tables relate to each other in different situations.
In conclusion, with relationships
・Aggregation calculations performed in data tables are aggregated within the range of each table. Thereafter, when the aggregation results are used across the data table, the aggregation results are related to each other.
・The row-level calculations of fields in a table are performed in the table as it is.
・The row-level calculation across the data table is performed by combining all the records in the range related by the key.
Case 5
Relationships between individual transaction data (Cases where there are missing Months in sales and purchases)
Now, given the relationships that avoid duplicating records, you might think that there is no longer a need for data blending. But that's not true. Now we want to see the difference between a relationship and a data blend (blending).
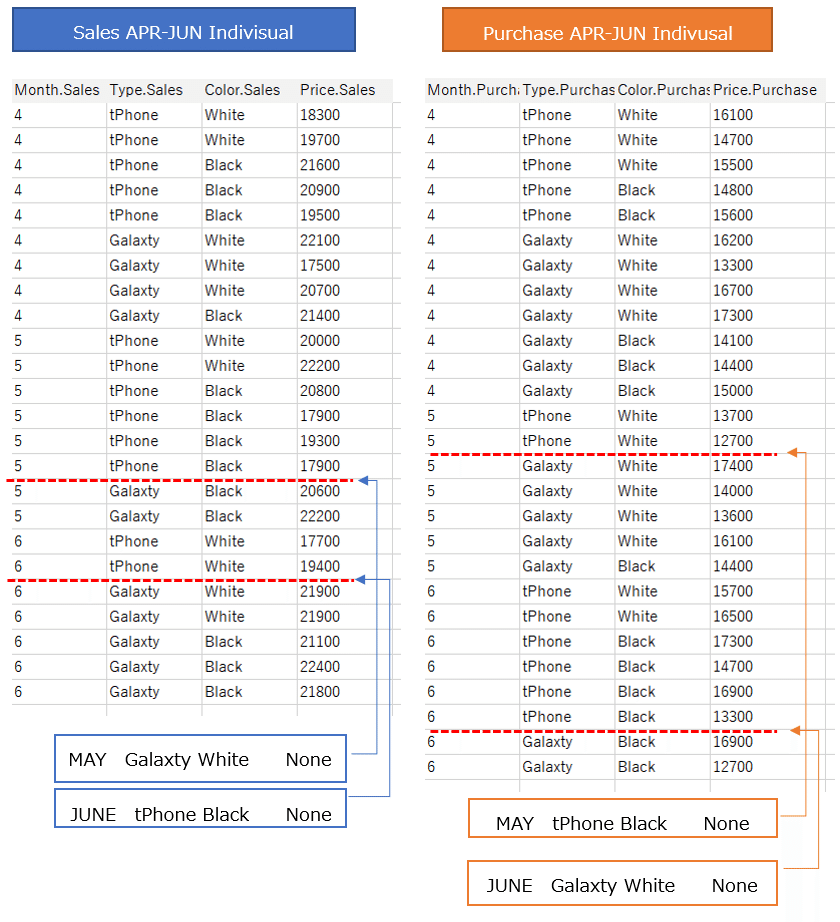
The next time you use it is not January – March data as before.
Individual transaction data for sales and purchase from April to June.

In sales data: There was no sales of
May Galaxty white
and
June tPhone Black
In purchase data: There was no purchase of
May tPhone Black
and
June Galaxty white
I'm going to keep this lack of data in mind and try to connect again.
With this data source:
We will continue to visualize sales quantity and purchase quantity by Month, Type, and Color.
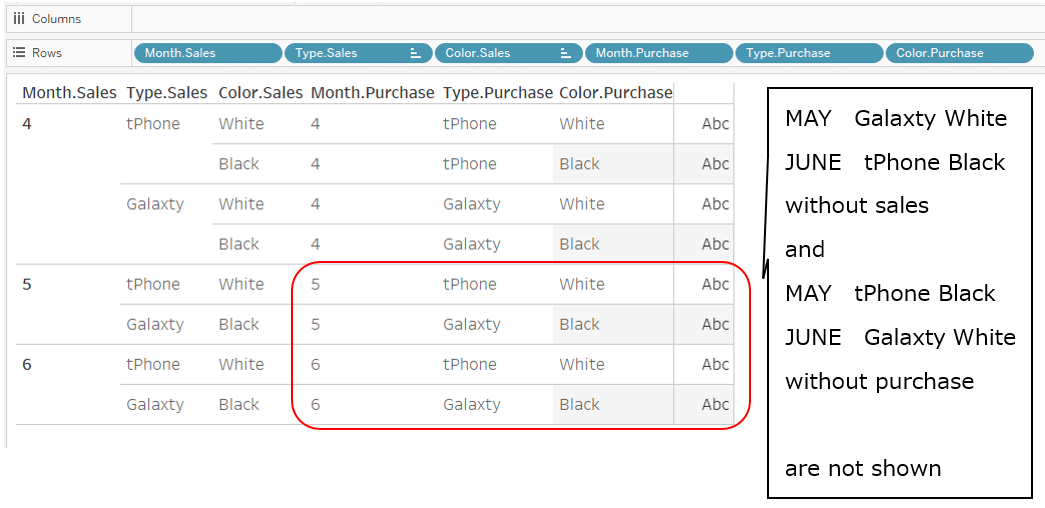
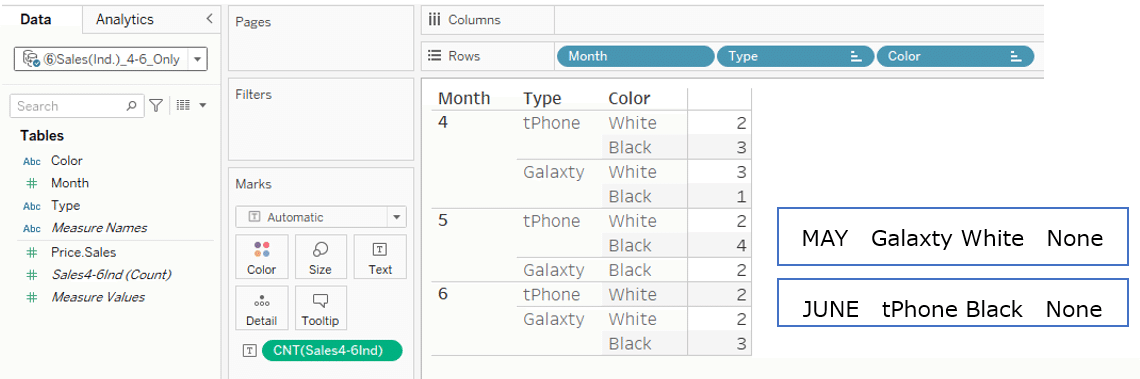
First, try to use the Month, Type and Color dimension from the sales table.
The completed Viz is shown below.
For
May Galaxty white and June tPhone Black
with no sales data,
the purchase data is displayed as "Type is Null and Color is Null" in the upper left corner.
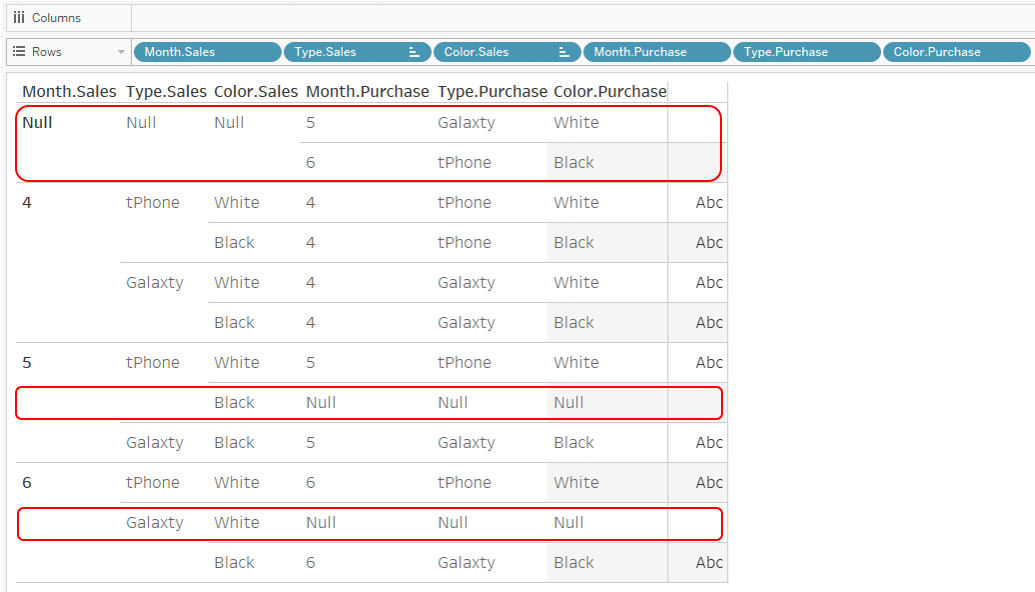
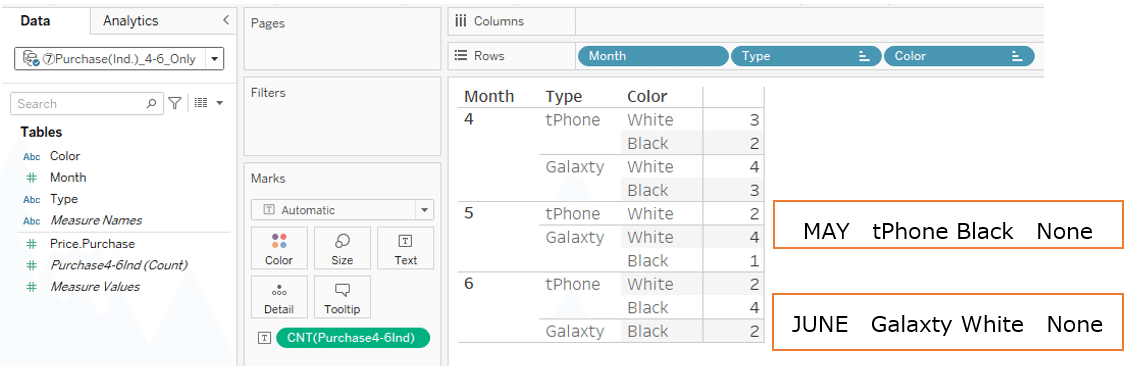
If you use the Month, Type and Color dimension from the purchase table,
Viz is shown below.
This time, for
May tPhone Black and June Galaxty white
with no purchase data,
the sales data is displayed as "Type is Null and Color is Null" in the upper left corner.
The reason of this is:
The keys are set in a relationship, and when you associate a data table, records that have no counterpart are not associated.
In this way, we found that there are months with no sales data and months with no purchase data, so we will now compare the sales quantity and purchase quantity for each Type and for each Color without analyzing each Month.
We have removed the Month dimension from the column as shown below.

However, as shown in the above figure, the data in the part where "Type is Null and Color is Null" is displayed.
If you aggregate the data from April to June by Type and Color, not by Month,
In this way, the sales and purchase quantities are available for all combinations.
However, in the above Viz where the dimension is Type and Color,
This aggregate value is not displayed well.
The reason is:
The key to the relationship is determined during the creation of the data source. Data other than the range in which all of the keys match, is never associated.
In other words, if you use just Type and Color as the dimension for Viz,
the key to the relation is still "Month, Type and Color".
Month is still included in the keys. This key does not change unless you change it in the relations settings screen.
In the results,
If you use Type, Color of the sales table for the dimension,
Purchase data of
May Galaxty white and June tPhone Black
with no sales data
is displayed as "Type is Null and Color is Null". (Figure below)
Also,
If you use Type and Color of the purchase table for the dimension,
sales data of
May tPhone Black and June Galaxty white
with no purchase data
is displayed as "Type is Null and Color is Null". (Figure below)
What will happen if you use data blending?
I would like to see it in the next case.
*Addendum
If you set up a relationship and there are records with mismatched keys,
when you use the only dimensions for Viz, you won't see records with mismatched keys.
This is like excluding records whose keys do not match with inner join.
If you also want to see records with mismatched keys,
click Analysis menu on the screen, select Table Layout – Show Empty Rows, Show Empty Columns.
With this, you can display them.
On the other hand, if you also use measures for Viz, records with mismatched keys will also appear in Viz.
This is like the behavior of a full outer join.
Case 6
Data blending between individual transaction data (Cases where there are missing Months in sales and purchases)
Now I want to do something similar to Case 5, using Data Blending.
We will continue to use the same sales April-June data and purchase April-June data as in Case 5.
Same as case 5,
In sales data: There was no sales of
May Galaxty white
and
June tPhone Black
In purchase data: There was no purchase of
May tPhone Black
June Galaxty white
This time, we connected each data table separately and made two different data sources.
The following is the data source for the sales table:
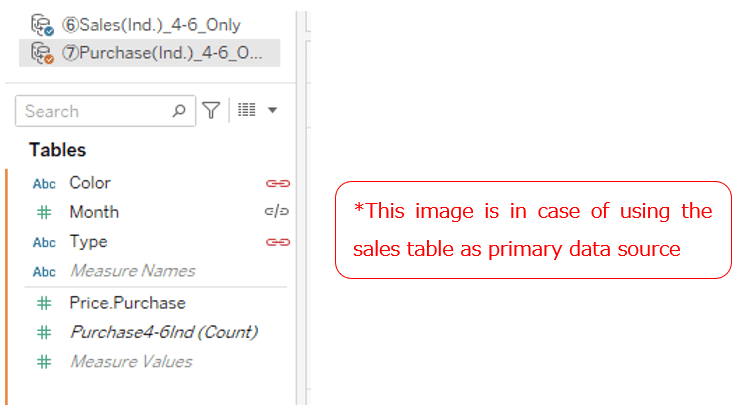
And below is the data source of the purchase table.
*Addendum
Each of the Month, Type, and Color fields has been renamed to “Month”, “Type”, “Color”. (This is to make the blend relationship work automatically.)
First of all, I'm going to make a Viz that shows sales and purchases by Month, Type and Color, just like Case 5.
What matters here is whether you use the sales table or the purchase table as your primary data source.
・sales table is the primary data source and the purchase table is the secondary data source
・purchase table is the primary data source and the sales table is the secondary data source
Both ways are possible.
First, the former
"sales table is the primary data source and the purchase table is the secondary data source"
I'll make it with.
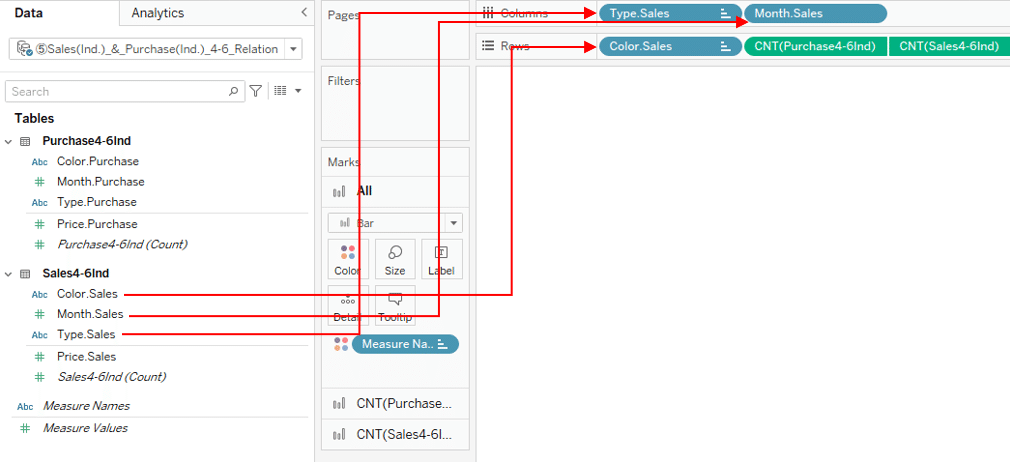
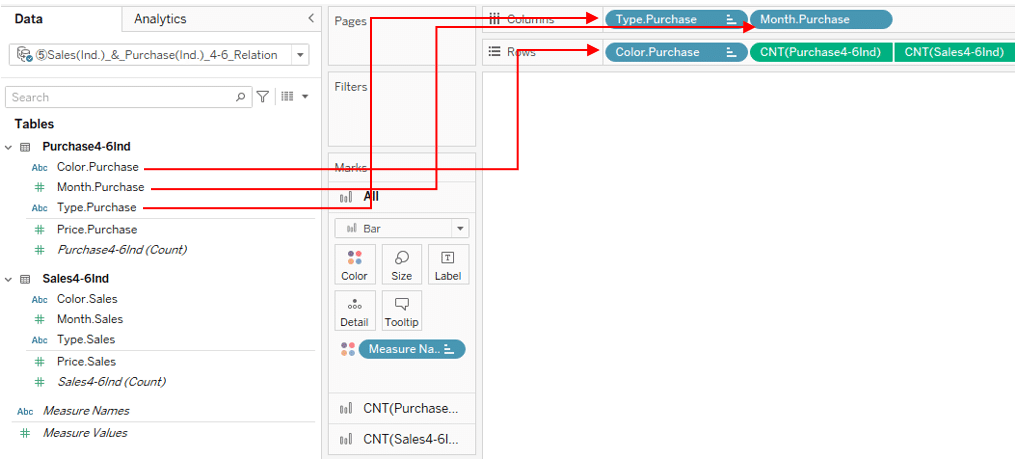
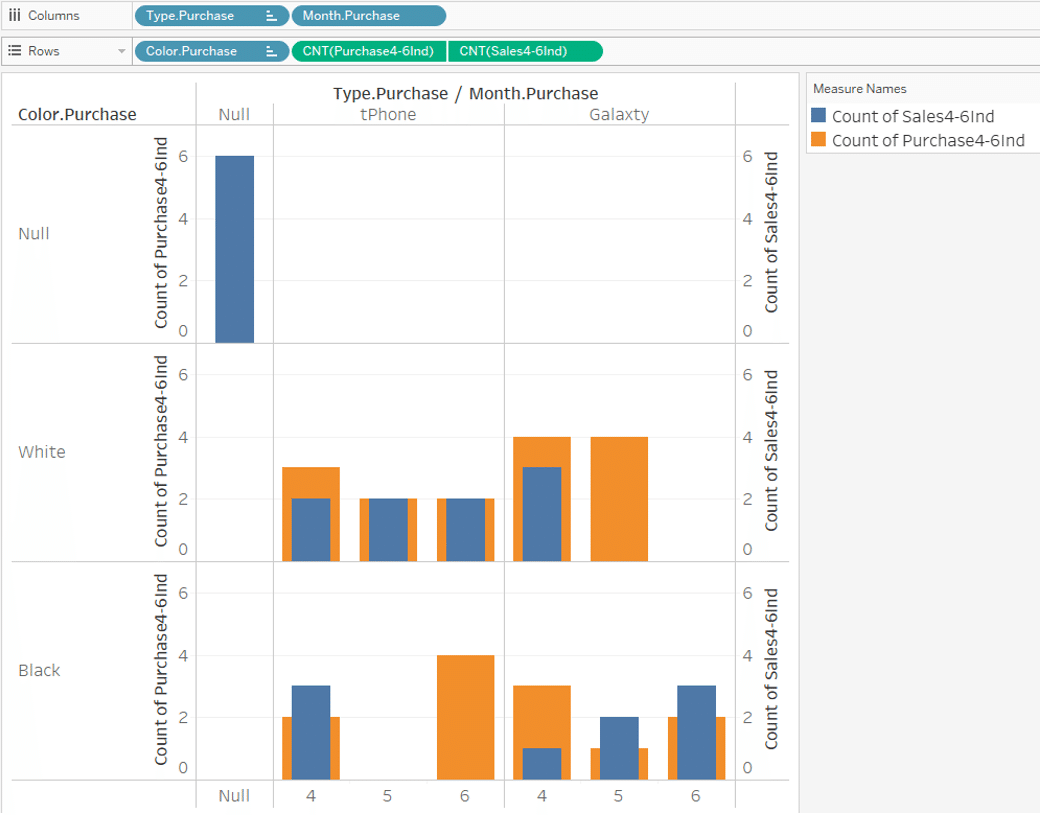
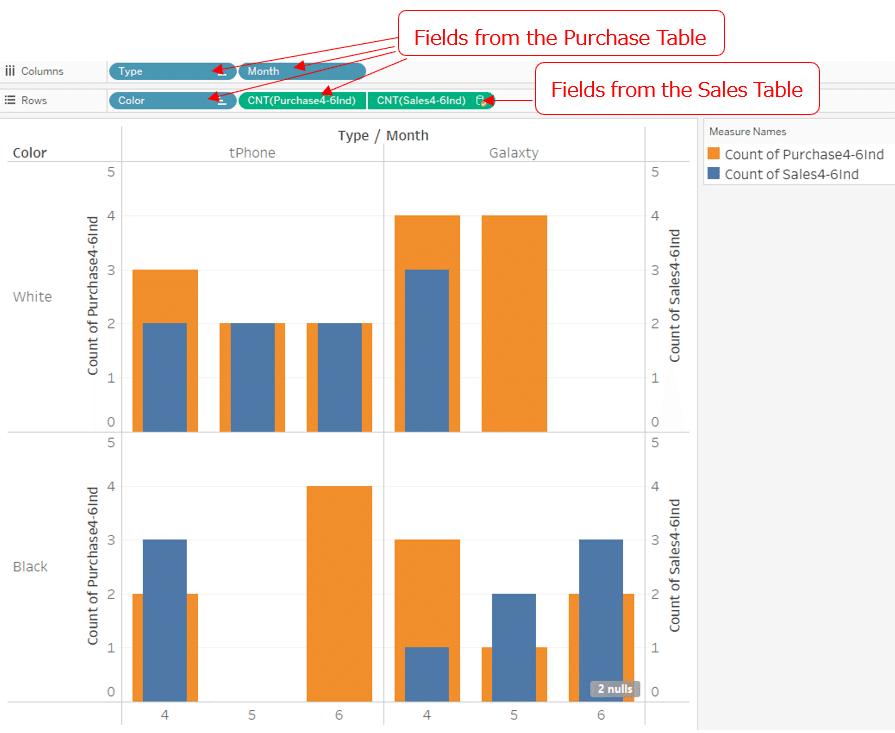
Use the sales table as the primary data source and the Month, Type, and Color fields as dimensions.
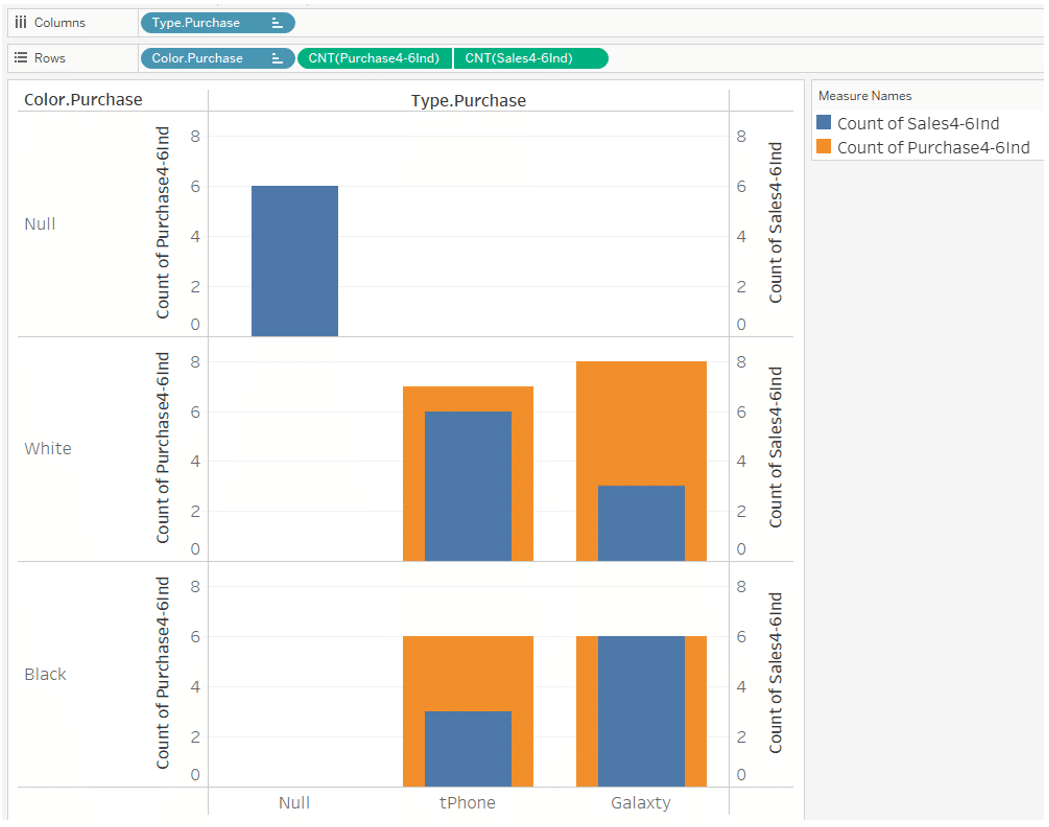
As a measure, I use the count on the sales table and the count on the purchase table. The viz is as shown in the figure below.
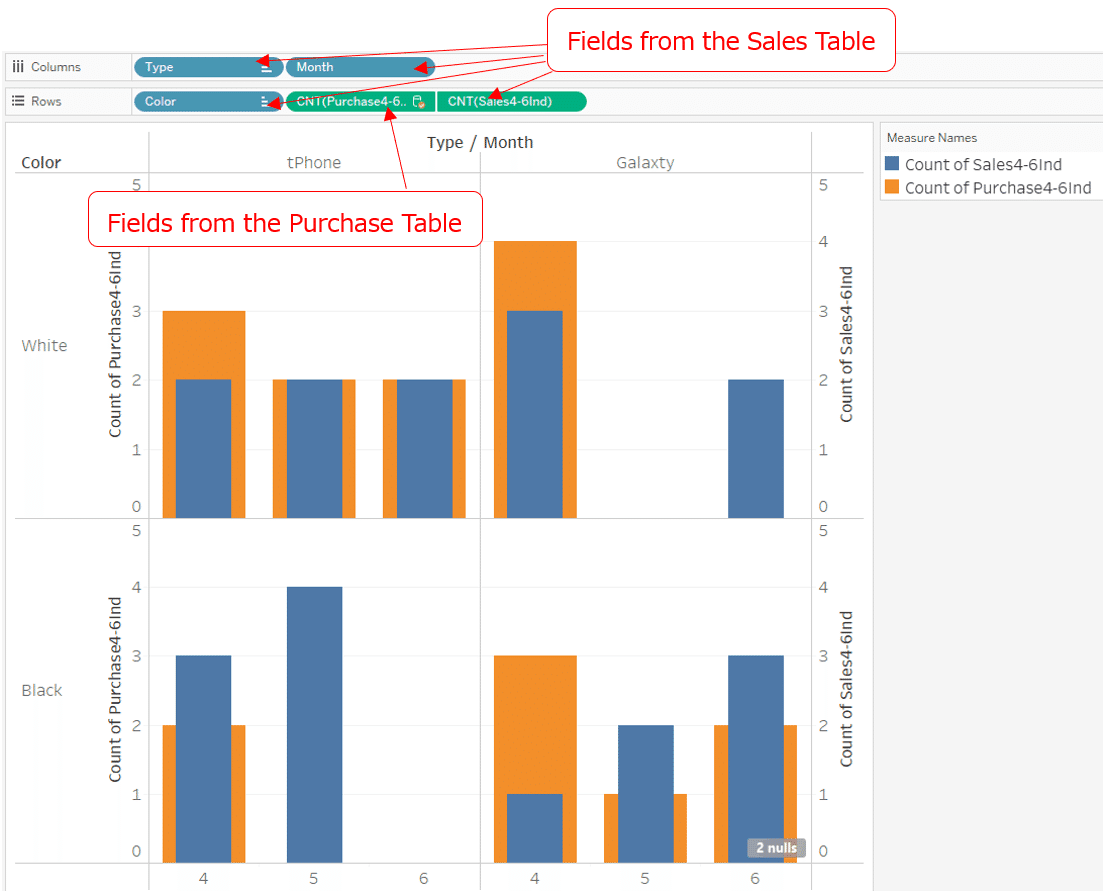
In this Viz, the blend relationship keys are automatically "Month", "Type" and "Color". In the data pane for the secondary data source, you can see that the "Month," "Type" and "Color" chains are orange and associated with the primary data source.
What you notice when you look at this Viz is that:
In the cells without purchase data,
May, tPhone, black
June, Galaxty, white
only the sales table count (blue) is shown.
Since there is no purchase data for these Month, Type and Color, it is not particularly strange that the data on the purchase table is not displayed.
Another thing to notice is that:
In the cells without sales data,
May, Galaxty, white
June, tPhone, black
there are no bars.
For these Month, Type and Color, there were purchases, but the purchase data is not displayed and is null.
There's also a "2 nulls" indicator in the lower right corner of the worksheet.
This is because of the characteristic of Data blending that:
'Where there is no data in the "primary data source," there is no association with the secondary data source and consequently no data from the secondary data is displayed.'
So what happens when you swap primary and secondary data sources?
I'll try it right away.
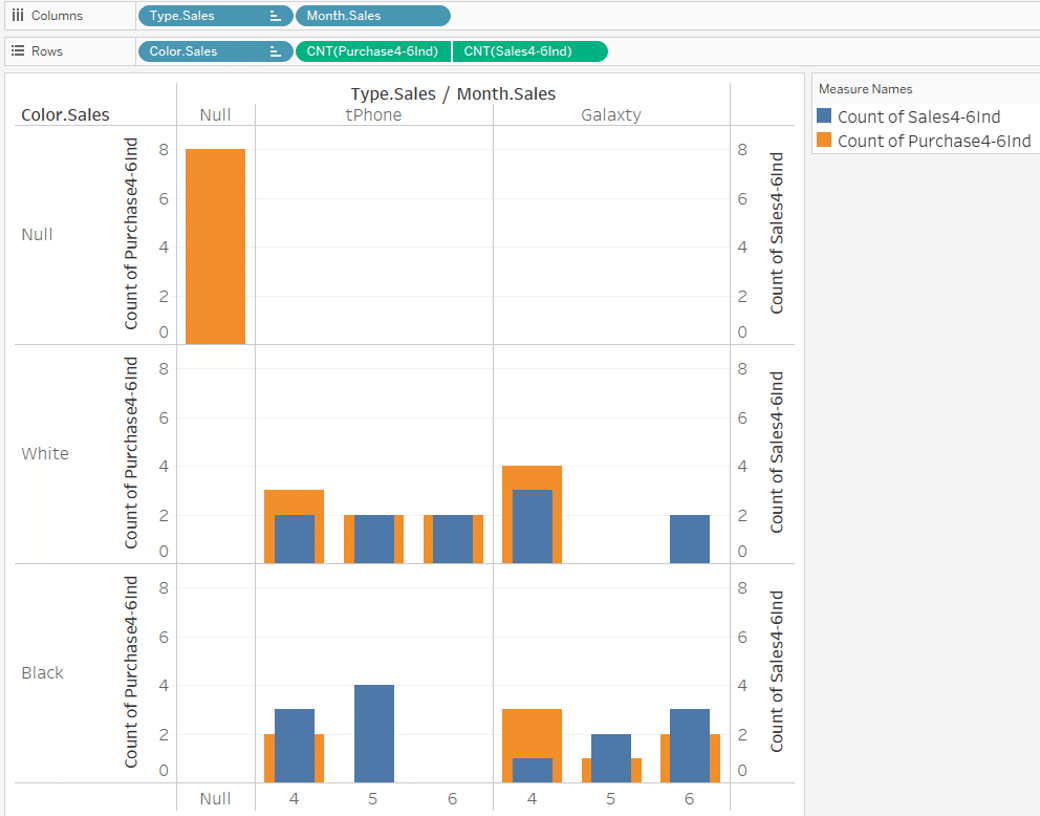
Next, we use the purchase table as the primary data source and the Month, Type and Color fields as dimensions. As for the measure, I use the count on the sales table and the count on the purchase table.The viz is as shown in the figure below.
Now,
In the cells without sales data,
May, Galaxty, white
June, tPhone, black
only the purchase table count (orange) is shown.
On the other hand,
In the cells without purchase data,
May, tPhone, black
June, Galaxty, white
there are no bars.
For these Month, Type and Color, there were sales, but the sales data is not displayed and is null.
This is the same reason as before. Now that the purchase table is the primary data source. So the Month, Type and Color, type that are not in purchase table became null.
So far,
"Depending on the month, there are months without sales data and months without purchase data. And in those cells data is not displayed."
In that point, it's very similar to the situation when used relationships in Case 5.
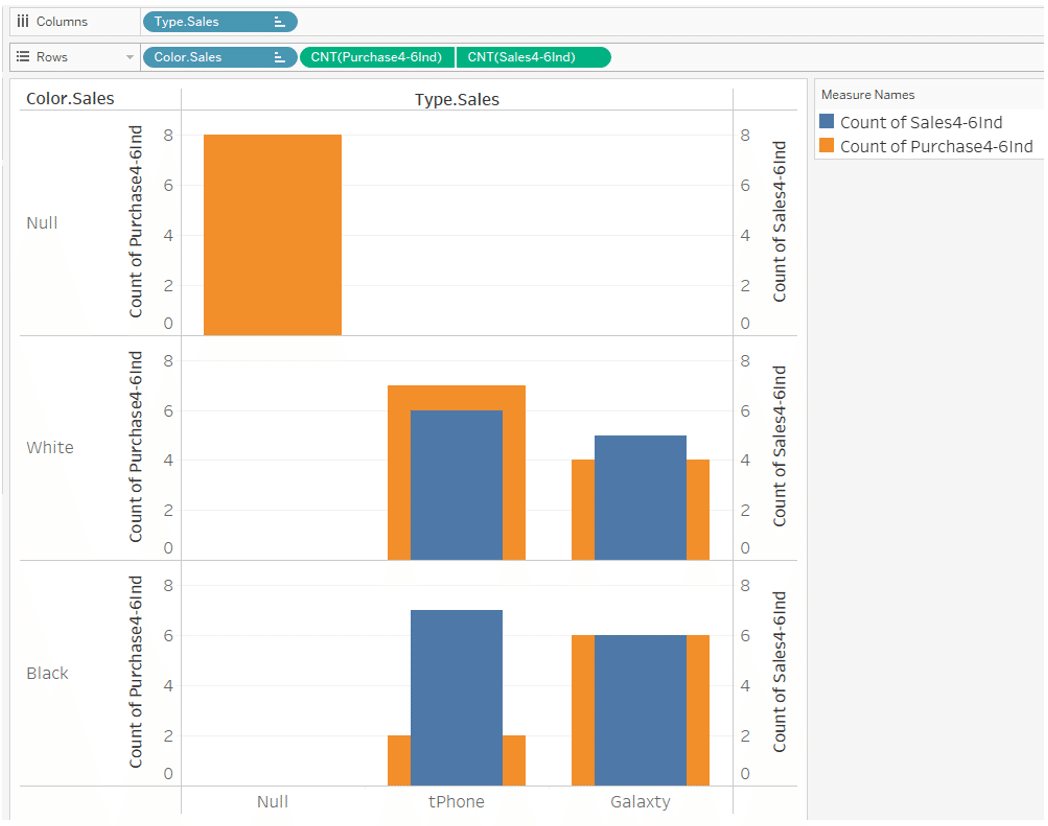
Now, as in Case 5, we will compare the sales quantity and purchase quantity for each Type and for each Color without analyzing each Month.
To do this, simply remove the Month that is currently in the column.
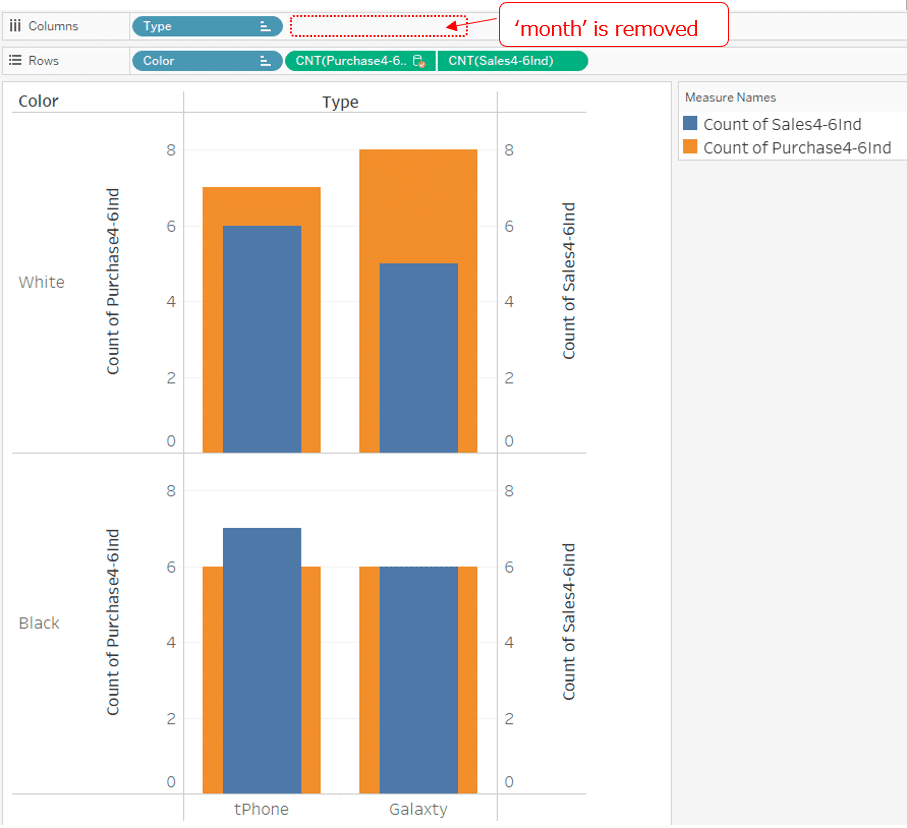
Then, without considering about the month, it becomes a Viz that displays the sales and purchase quantities by Type and Color.
(This is same whether the primary data source is the sales table or the purchase table.)
Different form Case 5 using relationship, records that result in nulls do not occur.
This is because in this Viz, the blend relationship keys are only "Type" and "Color". "Month" is not the blend relationship key.
In the data pane for the secondary data source, only chains of "Type" and "Color" are orange and associated with the primary data source.
On the other hand, when using relationships in Case 5,
(I mean when you use data tables that have records that don't connect by relationship key)
in order to do
"compare the sales quantity and purchase quantity for each Type and for each Color without analyzing each Month",
you need to open the data source edit screen and remove the "Month" from the relationship key. However, this relationship key change affects all workbook and worksheets that use the same data source.
It is possible to duplicate the data source and use it as another data source, but it is also cumbersome.
On the other hand, the key of the blend relationship can be freely changed from worksheet to worksheet.
This is where data blending and relationships are very different, and where Data Blending really comes into its own.
The main points are as follows.
The keys for the relationship are fixed at the time the data source is created.
→ described as “Static”
Data blending (blending) keys can be changed arbitrarily on a worksheet by worksheet basis.
→ described as “Flexible”
Summary
The ability of relationship to connect data tables to avoid record duplication is very revolutionary.
Better performance is expected with no join queries.
Another great advantage is that you can publish data sources with relationships on Tableau server and Tableau online.
However, this does not seem to remove the role of joins or data blending.
We can see Tableau HP for more details about differences of
・Join
・Relationships (Relation)
・Data blending (Blending)
https://help.tableau.com/current/pro/desktop/en-us/relate_tables.htm
I am still studying it too, but I would like to list each use cases I can think of. (As of July 2021)
Join
・If you want to exclude unnecessary data by joining methods such as inner joins, left outer joins, and right outer joins.
・If the association is one-to-one and you do not need to worry about record duplication.
・Tring many-to-one (or one-to-many) join such as a join with a master table, but the only dimension on which the record is duplicated.
・Because you are going to create an extract file, you do not need to consider the performance degradation caused by join queries.
Relationships
・When records are duplicated if join is done with one-to-many, many-to-one, or many-to-many association
・When three or more tables are related and it will be too complicated if you use join
・If you want to improve performance by allowing queries for relating tables to occur only when necessary.
・If you want to publish a data source with a relationship.
Data blend (blending)
・If you want flexibility in changing the key of an association from worksheet to worksheet.
・If it is easier to treat a data table as a separate data source and associate it with a data blend only on worksheets as needed
・If you want to take advantage of primary data sources (The join after aggregation is a left outer join with the primary data source on the left.)
・If you want to associate data that originally existed as another data source.
I hope we would use these three properly.
Thank you very much for reading this long article.
In writing this article,
I referred to the following web page of SPLINE company.(Japanese only)
https://ec.splineglobal.com/blogs/news/tableau-2020-2-data-modeling
By ritz _ Tableau
Tableau Visionary | 2021 Tableau Zen Master |
| 2019-2021 Tableau Public Ambassador |
Tableau Certified Professional | Data Saber
Twitter: @ ritz _ Tableau
Tableau Public: https://public.Tableau.com/profile/satoshi.ganeko#!/
Precautionary statement
For non-commercial use, please fell free to reprint it without permission.
Please include a link to this article and indicate that it is reprinted.
Please do not reprint without permission for commercial use.
I am trying to provide the most accurate information possible about the content in this article, but it might contain misinformation or be out of date.
この記事が気に入ったらサポートをしてみませんか?