コスト想定

割引率は 3%
import pandas as pd
import matplotlib.pyplot as plt
# Data from the user
data = {
"Technology": ["Solar PV", "Wind Onshore", "Wind Offshore", "Run of River", "Geothermal", "Battery"],
"Investment": [533, 902, 2218, 2156, 4303, 310],
"Fixed O&M": [1.5, 3, 4.3, 2.5, 2.9, 2.9],
"Unit": ["kW", "kW", "kW", "kW", "kW", "kWh"],
"Lifetime": [25, 25, 25, 30, 30, 20],
"Efficiency": [100, 100, 100, 100, 83, 81]
}
# Create DataFrame
df = pd.DataFrame(data)
# Calculate annual costs without interest
df['Annual Investment Cost'] = df['Investment'] / df['Lifetime']
df['Annual O&M Cost'] = df['Investment'] * (df['Fixed O&M'] / 100)
df['Total Annual Cost'] = df['Annual Investment Cost'] + df['Annual O&M Cost']
# Interest rate
interest_rate = 0.03
# Calculate annual cost with interest
df['Annual Investment Cost with Interest'] = df['Investment'] * (interest_rate * (1 + interest_rate) ** df['Lifetime']) / ((1 + interest_rate) ** df['Lifetime'] - 1)
# Update total annual cost with interest
df['Total Annual Cost with Interest'] = df['Annual Investment Cost with Interest'] + df['Annual O&M Cost']
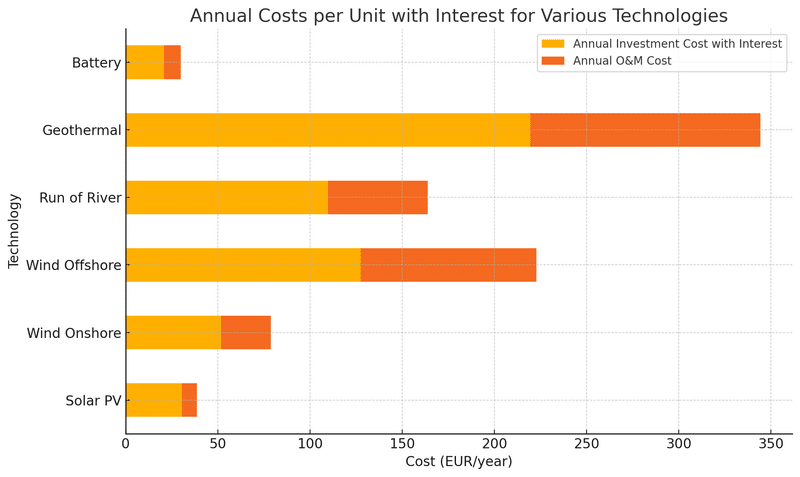
# Plotting the updated stacked bar chart in a horizontal layout
fig, ax = plt.subplots(figsize=(10, 6))
df.set_index('Technology')[['Annual Investment Cost with Interest', 'Annual O&M Cost']].plot(kind='barh', stacked=True, ax=ax)
ax.set_xlabel('Cost (EUR/year)')
ax.set_title('Annual Costs per Unit with Interest for Various Technologies')
plt.tight_layout()
plt.show()
import pandas as pd
import matplotlib.pyplot as plt
# Data input
data = {
"Technology": ["Solar PV", "Wind Onshore", "Wind Offshore", "Run of River", "Geothermal", "Battery"],
"Investment": [533, 902, 2218, 2156, 4303, 310],
"Fixed O&M": [1.5, 3, 4.3, 2.5, 2.9, 2.9],
"Unit": ["kW", "kW", "kW", "kW", "kW", "kWh"],
"Lifetime": [25, 25, 25, 30, 30, 20],
"Efficiency": [100, 100, 100, 100, 83, 81]
}
# Create DataFrame
df = pd.DataFrame(data)
# Interest rate for recalculation
interest_rate = 0.03
# Initial annual costs calculation
df['Annual O&M Cost'] = df['Investment'] * (df['Fixed O&M'] / 100)
# Calculate annual cost with interest rate
df['Annual Investment Cost with Interest'] = df['Investment'] * (interest_rate * (1 + interest_rate) ** df['Lifetime']) / ((1 + interest_rate) ** df['Lifetime'] - 1)
df['Total Annual Cost with Interest'] = df['Annual Investment Cost with Interest'] + df['Annual O&M Cost']
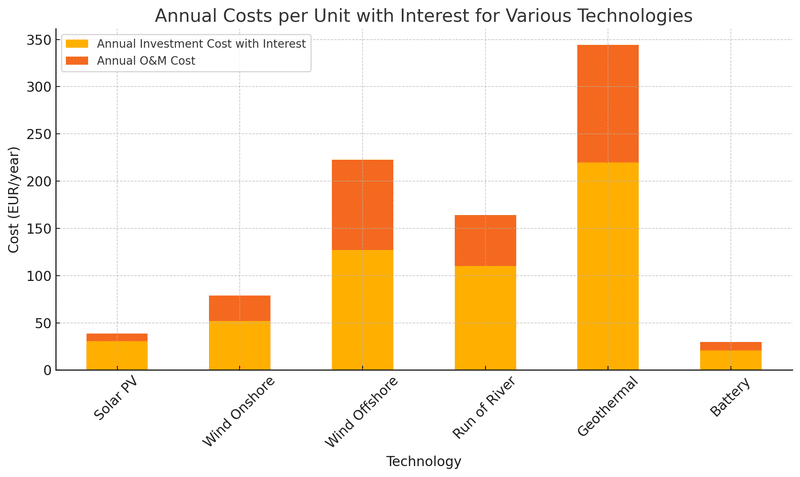
# Plotting the costs with interest
fig, ax = plt.subplots()
df.set_index('Technology')[['Annual Investment Cost with Interest', 'Annual O&M Cost']].plot(kind='bar', stacked=True, ax=ax)
ax.set_ylabel('Cost (EUR/year)')
ax.set_title('Annual Costs per Unit with Interest for Various Technologies')
plt.xticks(rotation=45)
plt.tight_layout()
plt.show()
この記事が気に入ったらサポートをしてみませんか?