
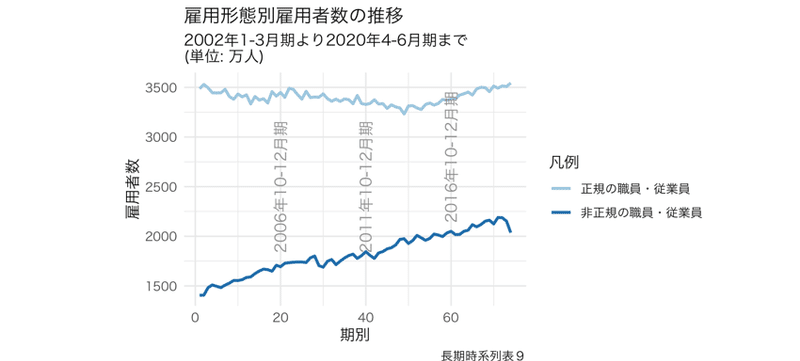
雇用形態別雇用者数の推移

## 雇用形態別雇用者数

```
[詳細集計]			長期時系列表9 (1)年齢階級(10歳階級)別就業者数及び年齢階級(10歳階級),雇用形態別雇用者数 - 全国		(男女計)

[Detailed  Tabulation]		Historical data 9  (1) Employed person by age group (ten-year group) and Employee by age group (ten-year group) and type of employment - Whole Japan	(Both sexes)
```

```{r,warning=FALSE,message=FALSE}
library(readr)
雇用形態別雇用者数 <- read_csv("雇用形態別雇用者数.csv")
status <- 雇用形態別雇用者数
stts <- status[,c(5,6)]
status[c(20,40,60),c(1,5,6)]
stts$index <- 1:74
colnames(stts)[1:2] <- c("正規の職員・従業員","非正規の職員・従業員")
```

```{r}
library(tidyr)
dat_ <- gather(stts,"key","value",-index)
```

```{r,echo=TRUE,warning=FALSE,fig.width=6,fig.asp=0.618,out.width="70%",fig.align="center"}
library(ggplot2)
library(RColorBrewer)
ggplot(dat_,aes(x=index,y=value,group=key))+
 geom_line(size=1,aes(col=key))+
labs(x="期別",y="雇用者数",title="雇用形態別雇用者数の推移",caption = "長期時系列表9",subtitle = "2002年1-3月期より2020年4-6月期まで\n(単位: 万人)",col="凡例")+
guides(color=guide_legend(reverse = FALSE))+
scale_color_brewer(palette = "Paired")+
xlim(1,74)+
annotate("text",x=20,y=2500,label="2006年10-12月期",angle=90,color="grey60",family="HiraKakuProN-W3")+
annotate("text",x=40,y=2500,label="2011年10-12月期",angle=90,color="grey60",family="HiraKakuProN-W3")+
annotate("text",x=60,y=2800,label="2016年10-12月期",angle=90,color="grey60",family="HiraKakuProN-W3")+
theme_minimal(base_family = "HiraKakuProN-W3")
```この記事が気に入ったらサポートをしてみませんか?