牡蠣とパグを機械学習で判別してみた

はじめに
機械学習で教師ありの分類を勉強したので、遠くから見ると似て見えるパグと牡蠣を判別するモデルを作ってみたいと思い取り組みました。
そのパグと牡蠣はこちらです。
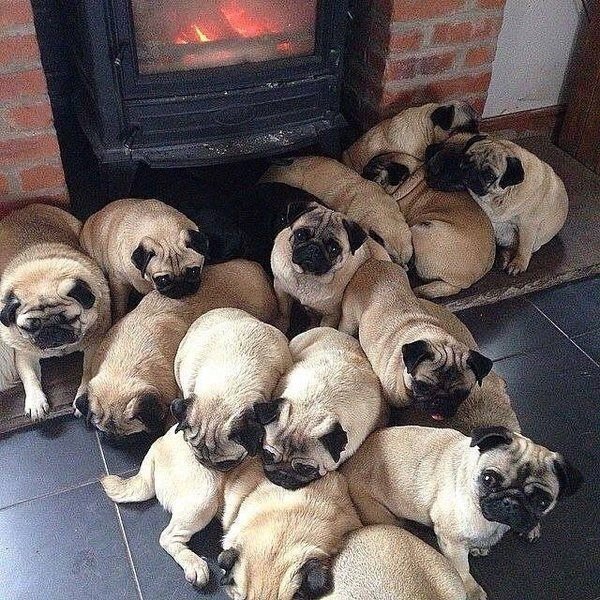
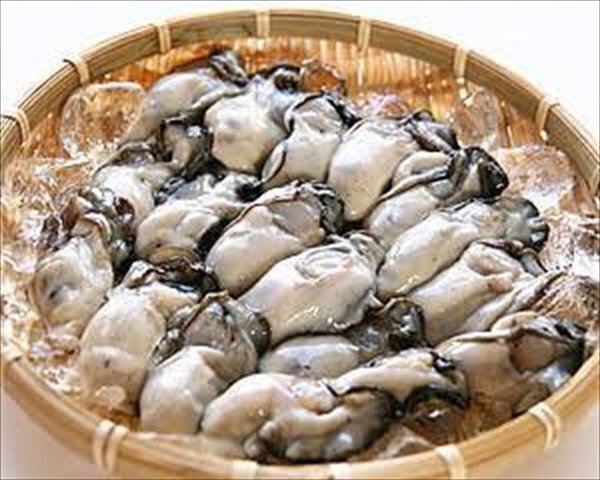
私は視力0.01程度ですが、裸眼で見たら判別は不可能です。
今回はパグと牡蠣を判別する分析器を作ってみたいと思います。
データ分析の流れ
1.データの収集
2. データの作成
3. モデルの選択(Gridsearch)+学習
4. テストデータで予測、出力
pipのインストール
!pip install icrawlerモジュールのインポート
import os
import glob
import numpy as np
import pandas as pd
import matplotlib.pyplot as plt
from PIL import Image
from sklearn.model_selection import train_test_split
from icrawler.builtin import GoogleImageCrawler #画像スクレイピング
from sklearn.preprocessing import StandardScaler
import seaborn as sns
from sklearn.ensemble import RandomForestClassifier
from sklearn.model_selection import GridSearchCV
from sklearn.metrics import roc_curve, recall_score, confusion_matrix, accuracy_score
1.データの収集
データの収集にあたっては1つ1つ画像検索、保存していては途方もないのでicrawlerを使います。icrawlerのBingImageCrawlerはGoogleやBing等の検索エンジンで指定したキーワードを画像検索して帰ってきた画像を自動でダウンロードしてくれるPythonライブラリです。
 #画像スクレイピング
def scrape_img(keyword,max_num,path):
    crawler = BingImageCrawler(
        downloader_threads = 4,
        storage = {'root_dir' : path}
    )
    crawler.crawl(
        keyword = keyword,
        max_num = max_num
    )
    print('Done')
 #pathの定義
pug_path = 'pug/*.jpg'
kaki_path = 'kaki/*.jpg' #scrape
scrape_img('パグ',10,'pug/')
scrape_img('牡蠣',10,'kaki/')
pathの定義付けを行います。
 #pathの定義
pug_path = 'pug/*.jpg'
kaki_path = 'kaki/*.jpg' #scrape
scrape_img('パグ',10,'pug/')
scrape_img('牡蠣',10,'kaki/')
2.データセットの前準備と作成
そのままの画像ではサイズがばらばらなのでリサイズを行います。
ここでは300×300に設定。
# 画像のリサイズ関数
def img_resize_func(path,size):
    img_paths = glob.glob(path)

    for i in img_paths:
        img = Image.open(i)
        img_resize = img.resize((size,size)) #1 :1
        img_resize.save(i) #上書き
    print('resize Done')


img_resize_func(pug_path,300)
img_resize_func(kaki_path,300)
次にデータセットの作成をして、pandasのDataframeの形にしておきます。
パグを['cluster'] = '0'、牡蠣を['cluster'] = '1'とします。
 #データセットの作成
def make_dataset(img_paths):
    dataset = []

    for i in img_paths:
        img = Image.open(i)
        img_array = np.asarray(img)
        s = img_array.shape[0] * img_array.shape[1] * img_array.shape[2]
        img_width = img_array.reshape(1,s)

        dataset.append(img_width[0])
    dataset = np.array(dataset)

    return dataset

pug_df = make_dataset(img_paths=glob.glob(pug_path))
kaki_df = make_dataset(img_paths=glob.glob(kaki_path))
 #karaage_dfとpoodle_dfの結合
pug_df = pd.DataFrame(pug_df)
kaki_df = pd.DataFrame(kaki_df)
pug_df['cluster'] = '0'
kaki_df['cluster'] = '1'
df = pd.concat([pug_df,kaki_df],axis=0)
df.dropna(how="any")
学習データとテストデータに分割します。
 #説明変数と目的変数に分割
cluster = df.cluster
X = df.drop(['cluster'],axis=1)

 #トレインとテストに分割
train_X,test_X,train_y,test_y = train_test_split(X,cluster,test_size=0.3,random_state=42)
3.グリッドサーチによる最適モデルの探索
 #ハイパーパラメーターの値の候補を設定
model_param_set_grid = {SVC(): {"kernel": ["linear", "poly", "rbf", "sigmoid"],
                                "C": [10 ** i for i in range(-5, 5)],
                                "decision_function_shape": ["ovr", "ovo"],
                                "random_state": [42]}}

max_score = 0
best_param = None

# グリッドサーチでハイパーパラメーターを探索
for model, param in model_param_set_grid.items():
    clf = GridSearchCV(model, param)
    clf.fit(train_X, train_y)
    pred_y = clf.predict(test_X)
    score = accuracy_score(test_y, pred_y)
    if max_score < score:
        max_score = score
        best_param = clf.best_params_

print("ハイパーパラメーター:{}".format(best_param))
print("ベストスコア:",max_score)
svm = SVC()
svm.fit(train_X, train_y)
print()
print('調整なし')
print(svm.score(test_X, test_y))ハイパーパラメーター:{'C': 0.1, 'decision_function_shape': 'ovr', 'kernel': 'poly', 'random_state': 42}
ベストスコア: 0.8333333333333334
調整なし
0.3333333333333333ハイパーパラメータの設定が完了。
4.モデルの適用・検証
テスト用に用意したデータを読み込み後、テストデータの出力。
 #test  dataの読み込み
test_img_paths = 'test_img/*.jpg'
img_paths = glob.glob(test_img_paths)
img_resize_func(test_img_paths,300)
test_data = make_dataset(img_paths)
predict = model.predict(test_data)
predict_df = pd.DataFrame(data=img_paths,columns=['name'])
predict_df['predict'] = predict
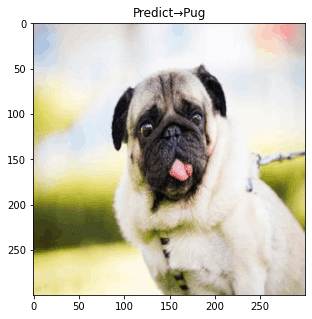
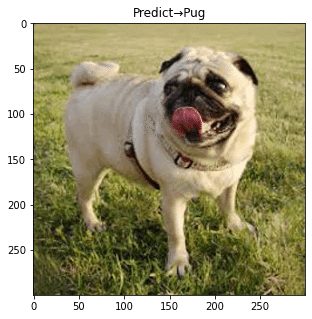
for i in img_paths:
plt.figure(figsize=(8,5))
judge = predict_df.loc[predict_df['name']==i,'predict'].astype(int).values
if judge[0] == 0:
judge = 'Pug'
elif judge[0] == 1:
judge = 'Kaki'
im = Image.open(i)
im_list = np.asarray(im)
plt.imshow(im_list)
plt.title('Predict→'+judge)
plt.show()
plt.tight_layout()
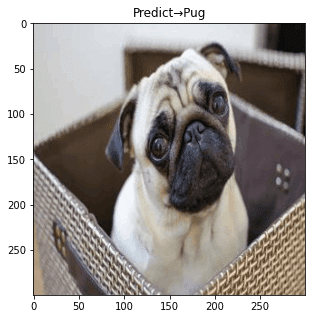

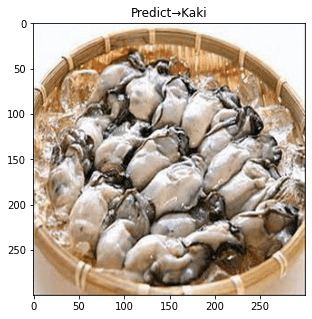
概ね正解しているものの、3枚目は不正解。
正解率を上げるために追加で以下2点を行いました。
①学習データの水増し(10枚→25枚)
②学習データのぼかし
5.データの水増し・再検証
①は割愛するとして、②のデータの画像ぼかしについては以下コードを利用。
img_resize = img_resize.filter(ImageFilter.GaussianBlur(4))
その上モデルの適用・検証を行ってみると….


全問正解!
画像水増しと学習データのぼかしによる効果を確認する事ができました。
この記事が気に入ったらサポートをしてみませんか?