基本のプロット -Figure と Axes- (matplotlib)

matplotlib.pyplot.subplots() 関数 は、Figure(matplotlib.figure.Figure クラスのインスタンス)と、Axes (matplotlib.axes.Axes クラスのインスタンス)、または Axes の配列を生成し、返り値として返します。
Figure はキャンバス、Axes はx軸、y軸 を持ち、その中にデータがプロットできるような描画領域兼コンテナ、というイメージです。
引数を省略すると、Figure の中に Axes が一つだけ生成されます。
#"Figure_and_Axes.py"
import matplotlib.pyplot as plt

fig, ax = plt.subplots()

ax.plot([0,1,2],[3,4,5])

plt.show()
次は、引数を指定した例です。引数のうち1番目の数字は行の数、2番目の数は縦列の数を指定します。sharex や sharey を指定してやると、共有する軸のラベルを省いてくれるそうです。(このオプション、記事を書いていて初めて知りました。)
#"Figure_and_Axes2.py"
import matplotlib.pyplot as plt

fig, axs = plt.subplots(2,1,sharex=True)

axs[0].plot([0,1,2],[3,4,5])
axs[1].plot([0,1,2],[6,7,8])

plt.show()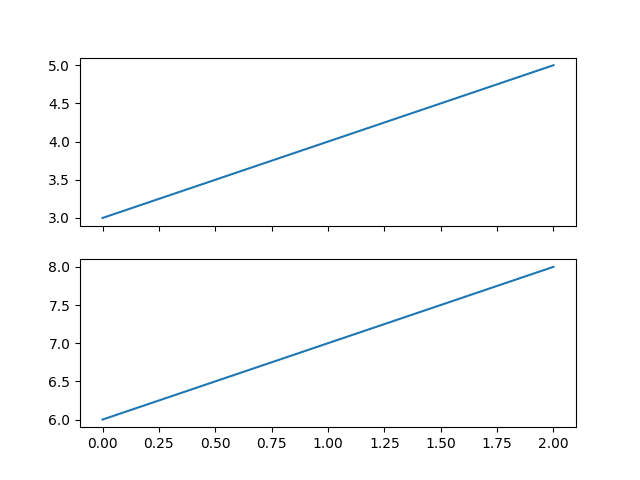
「単体 Axes」 と「Axes の配列」を区別するために返り値を受け取る変数名として "ax" "axs" を使うとよいとのこと。(axes はもともと axis の複数系なので分かりにくいから。)
参考URL:
https://matplotlib.org/stable/api/_as_gen/matplotlib.pyplot.subplots.html
この記事が気に入ったらサポートをしてみませんか?