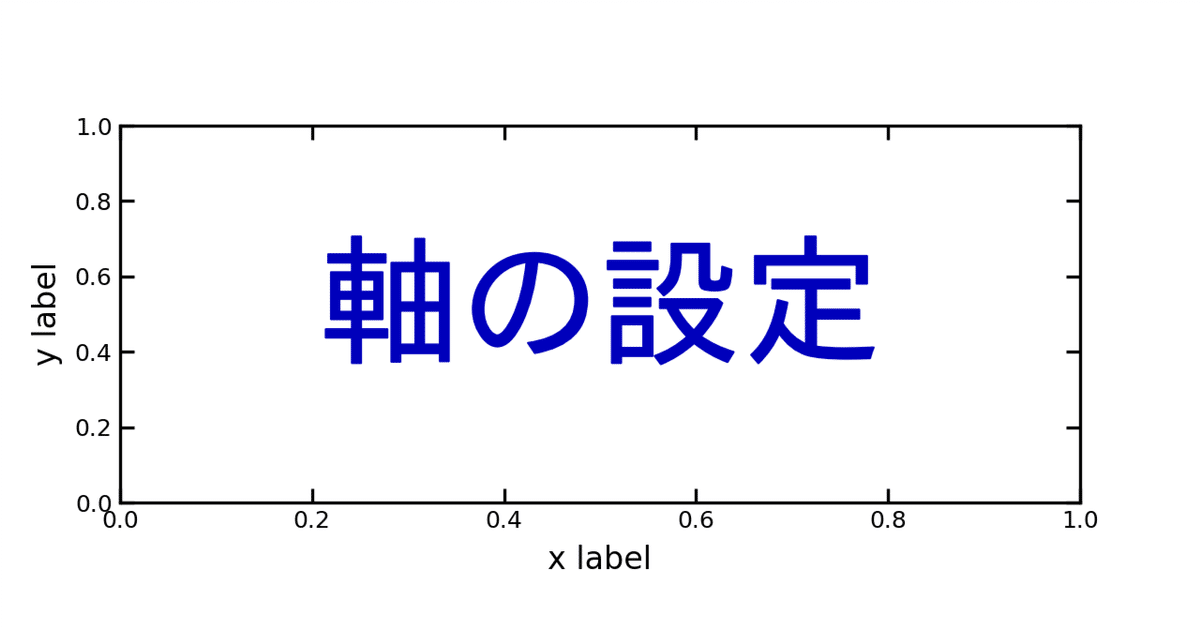
Axes の設定(matplotlib )
個人的な好みをメモしておきます。
デフォルトの出力も比較のため貼り付けておきます。
#"Axes_default_setting.py"
import matplotlib.pyplot as plt

fig,ax = plt.subplots()

fig.savefig("Axes_default_setting.png")
#"Axes_my_setting.py"
import matplotlib.pyplot as plt

fig,ax = plt.subplots()

ax.tick_params(axis='both', direction='in', top=True, right=True, labelsize=12, pad=4)
ax.set_xlabel("x label", labelpad=6, size=16)
ax.set_ylabel("y label", labelpad=6, size=16)

fig.savefig("Axes_my_setting.png")
参考URL:
https://matplotlib.org/stable/api/axes_api.html#ticks-and-tick-labels
https://matplotlib.org/stable/api/axes_api.html#axis-labels-title-and-legend
https://matplotlib.org/stable/api/text_api.html#matplotlib.text.Text
この記事が気に入ったらサポートをしてみませんか?
