Radioactive Dose Rate

Do you see the radiation dose blog after the Fukushima nuclear accident?
Q1: We wish to deduce "something" from the graph, what should you process data?
A: I'm sure that it is not good to plot the dose rate directly.
The decay of radioactive nuclei, exp{-At}, is not a straight line.
Then, I redraw a graph with Ln (dose rate).

Q2: OK. But it doesn't become a straight line. Why is that? And; why are there 2 steps and flicker at positions A, B, and C?
A: In a nuclear reactor, nuclei of uranium and/or plutonium are decayed; and the process generates heat. When those nuclei decay, they produce various radioactive nuclide. Among them, Xenon (Xe) 133 is generated in a particularly large amount. The next largest is Iodine (I) 132, 133. The third most common are Cesium (Cs) 134 and 137.
Radioactive nuclei decay over time and emit radiation. Radioactive nuclei are decayed itself automatically. It is not chemical reactions. There are multiple decaying processes in nuclear decay. They are written in the DB and are open to public. Many kinds of radioactive nuclei are vented from the nuclear power plant accident. Nowadays, after 10 years from the accident, they are Cs-134/137 that we can observe them. They have the half-life time, 2/30 years.
福島第一原発事故で放射性物質が流出した原子炉は1,2,3号炉です。4,5,6炉からは漏れていません。福島県沿岸部から西北に斜め方向に県域を汚染した3月14日22時からの放射性プルームは主に2号炉からのものです。そのCs-134,Cs-137比は1:1です。
地震は3月11日に起き、そのとき原子炉は停止しました。もし津波が地震後に来なかったとしたら、放射性物質の漏洩事故は起こらなかったと言われています。津波が外部電源と非常用電源を喪失させ、電源喪失が原子炉の冷却制御を失わせたのです。
The reactors in which radioactive materials were leaked in the Fukushima Daiichi Nuclear Power Plant accident are Reactors 1, 2 and 3. There is no leakage from the 4,5,6 furnaces. The radioactive plume from 22:00 on March 14, which polluted the prefecture area diagonally from the coast of Fukushima prefecture to the northwest, is mainly from the No. 2 reactor. Its Cs-134, Cs-137 ratio is 1: 1. The quake struck on March 11, and all reactors are shut down. This is important fact in order to estimate the dose rate calculation.
If the tsunami did not come after the earthquake, it is said that no radioactive material leak accident occurred. By the tsunami, external and emergency powers (7kV) are destroyed; and the loss of power makes lost-control of the reactors cooling.
では、2011.3.11から2021.3.11までのCs-134:Cs-137=1:1の崩壊曲線を計算します。Cs-134の半減期は2.0652Yです。計算式はA=alog(0.5)/(2.0652*365.25)です。alog()は自然対数です。ゆえにCs134=exp(A*day)で計算します。このdayは原子炉が停止した日です。
Cs-137の半減期は30.1Yです。計算式はB=alog(0.5)/(30.1*365.25)です。ゆえにCs137=exp(B*day)で計算します。
1:1混合なので、CsMix={exp(A*day)+exp(B*day)}/2です。これはCsの物質量[Bq]です。観測されるSv/h値ではありません。従って、[Bq]-->[Sv/h]への変換が必要です。
Now, let's calculate the collapse curve of Cs-134: Cs-137 = 1: 1 from 2011.3.11 to 2021.3.11.
The half-life of Cs-134 is 2.0652Y. The formula is A = alog (0.5) / (2.0652 * 365.25). alog () is the natural logarithm. Therefore, it is calculated by Cs134(day) = exp (A * day). The day is the elapsed day, from when the reactor shut down.
The half-life of Cs-137 is 30.1Y. The formula is B = alog (0.5) / (30.1 * 365.25).
Therefore, it is calculated by Cs137(day) = exp (B * day).
Since it is the 1:1 mixture, CsMix(A,B,day) = {exp (A * day) + exp (B * day)} / 2. This is amount of substance of radioactive-Cs, the unit is [Bq]. It is not the observed Sv / h value. Therefore, it is necessary to convert to [Bq]-> [Sv / h].
[Bq]-->[Sv/h]変換には、測定器の周囲の3D空間(半径70m*4=280m)の、
建造物の形状と材質、土壌の性質、水分量が必要です。放射性Csからのγ線の減衰を測定器に入射する全光束についてシミュレーションします。このシュミレータのコーディングは教養コースで実施できるレベルではありません。専門課程です。
ここでは、「測定器周辺の放射性環境が変化しない」という仮定のもとに、次元が[Sv/h]/[Bq]のスカラー係数K一つで代用します。Obs[Sv/h]=K*CsMix()[Bq]とするのです。
For [Bq]-> [Sv / h] conversion, in the 3D space around the measuring instrument (radius 70m * 4 = 280m); the shape and material of the building, the nature of the soil, and the amount of water are required. Simulate the attenuation of γ-rays from radioactive Cs for whole luminous flux incident on the instrument. The coding of the simulator is not at the level that can be lectured in liberal arts course. It is a specialized course.
Here, based on an assumption that the radioactive environment around the measuring instrument does not change, one scalar coefficient "K" with dimensions [Sv / h] / [Bq] is used instead. Obs [Sv / h] = K * CsMix () [Bq].
ではKをどうやって決定するのですか?
それは放射線量がCsMix()関数によく似た形状で安定して減衰しだした日の線量値から決定するのです。K=obs(day)/CsMix(A,B,day)です。
県北保険センターではA点の急激な低下(これは除染です)後の値でKを決定します。
So; how do we determine the "K"?
It is determined from the dose rate on the day when the radiation dose starts to decay stably in a shape similar to CsMix () function; K = obs (day) / CsMix (A, B, day). At the Fukushima prefectural North Insurance Center, "K" is determined by the value after a sharp drop in point A (it is decontamination).

K値を決定するため; 95 elepsed days (calender days, 2013/7/1)の線量値を0.35 μSv/hとして、Cs134+Cs-137の崩壊式で計算した線量値のグラフ(黒の曲線)は測定値(青のギザギザ曲線)とは一致しません。
それは何故ですか?
To determine the K value; We set the dose value at 95 elapsed days (calender days, 2013/7/1) to 0.35 μSv / h.
The graph of dose value (black curve) calculated by a decay expression of Cs134 + Cs-137 does not fit to the measured value (blue jagged curve).
Why is that?
他の放射性核の寄与ですか?
そう思うでしょうが、原子炉の内部の各核種の量は時々刻々シミュレーションされていて、そのデータを東京電力は把握しています。事故発生時点の核種の存在量は公表されています。
かつてはNetでも閲覧できたのですが、今は無いでしょう。
私の記憶では、半減期2年以上の主要放射性核種はCs-134,Cs-137で99%以上を網羅しています。ですから測定値と一致しない理由は、核種が環境中で移動している、ことを表しています。
Is it the contribution of other radioactive nuclei?
You may think so, but the amounts of each nuclide inside reactors are being simulated during whole times, and TEPCO is aware of those data. The absolute mass of nuclides at the time of the accident had been announced.
It used to be available on Inter-Net, but now it's gone.
In my memory, the major radionuclides with a half-life of 2 years or more are Cs-134 and Cs-137, which cover more than 99%. Therefore, the reason why it does not match the measured value indicates that the nuclides are migrating in the environment.
これから、環境中の放射性核種の移動を調べます。
第1に、Cs-134+Cs-137計算値と実測値との差をグラフで表します。
From now on, we investigate the movement of radionuclides in the environment.
First, the difference between the calculated value of Cs-134 + Cs-137 and measured value is shown in a graph. We get a graph.

赤線:Cs-134+Cs-137の線量値です。K値を定数、測定器周辺の半径280m以内の空間内で、放射性物質が移動しない仮定です。
青線:空間線量率の測定値です。公表精度は1 nSv/h(実際はもう1~2桁多いです)。
測定器は恒温槽に格納されていて、その温度も測定されています。公表されていません。
こういうことが分かったのは、事故当時、固定式・測定器のRAWデータがNet上に公表されたからです。今はそのデータは無いです。私はダウンロードしました。学生もこういうRAWデータを発見したら、その時に何をおいてもダウンロードすべきでしょう。
公表されたRAWデータはNaIシンチレータ、ICチャンバーの2種類の測定手段と、10秒毎の測定値までありました。大学などにある測定器よりはるかに高精度です。
こういう事実は報道されていませんので書きました。
Red line: Theoretical ambient dose rate values of Cs-134 + Cs-137 (1:1 mixture). The K value is a constant, and it is assumed that radioactive materials do not move within a space under the radius of 280 m.
Blue line: Measured value of the ambient dose rate. The accuracy is 1 nSv / h (actually, it is one or two orders of magnitude more).
The measuring instrument is stored in a constant temperature bath, and its temperature is also measured. Not published.
These were found; because the RAW data of fixed-type and measuring instruments was published on the Net at the time of the accident. There is no such data now. I downloaded them.
If students discover such RAW data, you should download them at any time.
The published RAW data included two types of measuring means, NaI scintillator and IC chamber, and measured dose rates every 10 seconds. It is much more accurate than the measuring instruments in universities.
I wrote these facts because they have not been reported.
暗黄色線: 赤、青線の差(Δ)をアフィン変換" f(Δ)=amp*(Δ+bias)" したものです。ここで、amp=10, bias=0.1です。
2つのパラメータamp,biasでCs-134+Cs-137の理論値に接近させます。
そうすると、どのようにして、理論値から離れたのか、その経過が可視化できます。
Dark yellow line: The difference (Δ) between the red and blue lines is affine-transformed, f (Δ) = amp *( Δ+bias). Where, we set "amp=10, bias=0.1".
By using the two parameters amp and bias, you make the yellow line approach the theoretical line of Cs-134 + Cs-137.
Then, you can visualize a process of how the difference-line deviated from theoretical value.
ここで、このアフィン写像の意味を説明します。
1.ampは差を拡大して見やすくする。
2.biasは、その地点の自然放射線量(バックグラウンドの線量値)と、曲線を上下方向に移動させる効果です。
地球上、どこの地点でも、その地の自然放射線量というバックグラウンドが存在します。日本では大体0.05μSv/hです。
Here, we explain the meaning of the affine-map.
1. "amp" widens the difference and makes it easier to detect the changes.
2. Bias is the natural radiation amount (background dose rates) at that point and the effect of moving the curve up and down.
Everywhere on earth, a background of natural radiation can be detected. In Japan, it is about 0.05 μSv / h.
差のアフィン写像から、
1.150~520elapsed days間、直線的に線量値が低下しています。
Bの鋭いギャップは降雪による、放射性物質の遮蔽です。
あまり報道されないのですが、雪が放射性の土壌の上に積もると、線量値が「水」の遮蔽により低くなります。
降雨で地面が濡れると、降雪ほどでは無いですが、同効果により線量値が低下します。
ゆえに、ギャップの部分を除外して線量値低下を解析します。
融雪後、地面が乾燥すると線量値は元に戻ります。
これは当然のことに思われるでしょう。いいえ、重要な事実を示唆しています。
From the affine map of the difference
1. The dose rate decreases linearly between 150 and 520 elapsed days.
The sharp gap in B (elapsed days 310~610) is the shielding of radioactive material by snowfall.
As under the less-broadcasting; When snow accumulates on radioactive soil, the dose rate is lowered by the "water" shielding.
When the ground gets wet due to rainfall, the dose value decreases due to the same effect, though not as much as snowfall. Therefore, the dose reduction is analyzed by excluding the gap part.
After melting the snow, the dose rate return to normal when the ground dries.
This seems natural. No!, it suggests important facts.
放射性のCsもナトリウムなどのアルカリ金属の一族です。
ナトリウムは化学実験で水と激しく反応して水酸化ナトリウムになります。
化学反応式は「Na+H2O=NaOH+H↑」です。
さらに水が存在すれば、NaOH→"Na+"+"OH-"; in water、とイオン状態になります。
さらに環境中では海水由来の塩素イオン"Cl-"や硫酸水素イオン"HSO4-"と対になって存在します。
水が無くなると+/-のイオン同志は結合し塩になります。NaCl(食塩)/NaHSO4です。これらの塩は水に溶けます。溶けると再びイオンに乖離します。
一方の水酸イオン"OH-"は水素イオン"H+"と反応して水H2Oになります。
水素イオンは環境中に普遍的に存在します。ゆえに環境中では食塩は雨で移動します。
以上はナトリウムの挙動ですが、セシウムも同じです。Naという文字をCsに置換できます。
Radioactive Cs is also a family of alkali metals such as sodium.
Sodium reacts violently with water chemicaly, and it becomes sodium hydroxide.
The chemical reaction formula is "Na + H2O = NaOH + H ↑".
If more water is present, it becomes the ionic state such as NaOH → "Na +" + "OH-"; in water.
Furthermore, in the environment, it exists as a pair with chlorine ion "Cl-" and hydrogen sulfate ion "HSO4-" derived from seawater, etc.
When water runs out, those "+/- ions" combine to form a salt. NaCl (salt) / NaHSO4.
These salts are soluble in water. When it melts, it dissociates into ions again.
On the counter hydroxide ion "OH-" reacts with the hydrogen ion "H +" to become water H2O.
Hydrogen ions are universally present in the environment. Therefore, salt moves in the environment due to rain.
The above is the behavior of sodium, but the same is true for cesium. You can replace the letter Na with Cs.
セシウム塩(CsCl)も可溶性です。しかし、セシウムイオン(Cs+)は内圏錯体*になります。同錯体は不溶性です。
*) セシウムは雲母や 2:1 型粘土鉱物に特異的に安定に結合する。
これら粘土鉱物は,ケイ素やアルミニウムの酸化物が 2 次元に広がった層が積み重なる構造を持ち,層と層の間に隙間(層間)があり,ここに様々なイオンを吸着する。特にセシウムイオンは安定に吸着される。これにはセシウムイオンのサイズが影響する。
これはナトリウムやカリウムイオン{Na+,K+}には無い性質です。
そのため、土壌表面の放射性セシウム(Cs-134+, Cs-137+)は降雨ではあまり移動しません。しかし、ゆっくりと土壌中を下層方向に移動します。移動速度は数cm/Yオーダです。従って、その線量値は物理的な半減期よりも早く減衰します。減衰形は「制約付きの拡散方程式になり、指数関数的減衰とは限りません」。
Cesium salt (CsCl) is also soluble. However, the cesium ion (Cs+) becomes an inner-sphere complex*. The complex is insoluble.
*) Cesium specifically and stably binds to mica and 2: 1 type clay minerals.
These clay minerals have a structure in which layers of silicon and aluminum oxides spread in two dimensions are stacked, and there is a gap (interlayer) between the layers, in which various ions are adsorbed. In particular, cesium ions are stably adsorbed. This is affected by the size of the cesium ion. This is a property not found in sodium and potassium ions {Na+, K+}.
Then; radioactive cesium (Cs-134+, Cs-137+) on the soil surface does not move much in rainfall**. However, it slowly moves down in the soil. The moving speed is several [cm/Y] order.
Therefore, the Cs-dose rate decays faster than the physical half-life.
The decay expression is "a constrained diffusion equation; that is, not necessarily exponential decay."
**) 降雨にも色々あります。洪水や山崩れをもたらす大雨、霧のような雨。
それらが土壌に作用するときは区別して考察しなければなりません。
霧雨のような場合は、水が土壌に浸透し通常の拡散、2次偏微分方程式型の拡散方程式に従います。
洪水の場合は、水の浸透は、通常の拡散ではなく、水が土の粒子間を通過するので、異常拡散です。
数学者は実数次元の偏微分方程式と考えています。専門課程では、この実数次元の偏微分方程式の解析的アプローチを学ぶ人もいるでしょう。
There are various types of rainfall, which are heavy rain, foggy rain. The former rain causes often floods and landslides. When they act on the soil, they are considered separately.
In the case of fog and rain, the water permeates the soil and is expressed by the normal diffusion equation of the second-order PDE.
In the case of floods, water infiltration is anomalous diffusion, as water passes between particles in the soil rather than normal diffusion. Mathematicians consider it as a real-dimensional PDE. In a specialized course, some will learn the analytical approach to the real-dimensional PDE.
気象学者は地面にいろいろなモデル構造を考えます。土壌が何段ものプール構造になっているとします。それらのプール間は有限流速のパイプで接続されている。ゆえに、流速が指数関数的にならず、パイプの太さに上限が設定されて、一定になる。
下段のプールに移行できない水は、表層を削って横方向に移動する。すなわち山崩れです。
ここでは、気象学者のアプローチを採用します。理解しやすいでしょう。
Meteorologists consider various model structures on the ground. They suppose the soil has a multi-tiered pool structure. The pools are connected by a finite flow rate pipe.
Therefore, the flow velocity is not exponential, and the upper limit is set for the thickness of the pipe and becomes a constant.
Water that cannot be transferred to the lower pool is scraped off the surface and moved laterally. That is, it is a landslide.
Here we adopt the meteorologist's approach. It's easy to understand.
水の流速が一定なら、放射性Csの下層の土壌への浸透量も一定です。
ゆえに、環境中の放射線量減衰も直線的になります。
そして、流量がパイプの太さで制限されている水量(閾値と言います)よりも小さくなったら、今度は通常の拡散になります。
現実には、モデルのように閾値で拡散型が切り替わるのではなく、ゆっくりと切り替わります。
このように考えれば、福島県県北保健センターの実測値が解釈できるでしょう。
If the flow velocity of water is constant, the amount of infiltration of radioactive Cs into the soil below is also constant.
Therefore, the radiation attenuation in the environment is also linear.
Then, when the flow rate becomes smaller than the amount of water (called the threshold) limited by the thickness of the pipe, this time it becomes normal diffusion.
In reality, the diffusion type does not switch at the threshold as in the model, but switches slowly.
If you think in this way, you can interpret the measured dose rates of the Fukushima prefectural Ken-poku Health center.
今回の環境中の放射性Cs線量値の減衰とは関係ないですが、重要な事実を言います。
台風による降雨のばあい、水の地下への浸透量以上に、地面の表層を大量の水が流れます。当然、わずかでも地面の低い方向へながれます。
そのとき、土壌を削って流れます。そうすると土壌中の放射性Csも錯体状態のままで、「土の懸濁体」として移動します。
ゆえに、大雨の後は、地表面の放射性Csの分布が変化しています。
すなわち、次元を持ったスカラー定数のKが変化します。
It has nothing to do with the decay of the radioactive Cs dose rate in the environment this time, but it is an important fact.
In the case of rainfall due to a typhoon, a large amount of water flows on the surface layer of the ground more than the amount of water that penetrates underground.
Of course, it flows towards lower gradient direction on the ground.
At that time, the soil is scraped and flows. Then, the radioactive Cs holds the complex in the soil; it moves as a "soil suspension (colloid)".
Therefore, after heavy rain, the distribution of radioactive Cs on the ground surface would be changed slightly.
That is, the K having dimensional constant is changed.
<idle talk>
定数Kは{Bq/mass]-->[Sv/h]という変換をします。phycal constantのようですが、場所によって異なります。そしてKの背景には放射性物質と放射線吸収材の空間分布があります。ゆえにKは物理定数ではありません。
しかし、それを導入したことにより、環境中の放射性物質の拡散について有益な議論が可能になりました。
The constant K does the conversion {Bq / mass]-> [Sv / h]. It seems to be a phycal constant, but it depends on locations. Behind K is the spatial distribution of radioactive materials and radiation absorbers. Therefore K is not a physical constant. However, the introduction has enabled a useful discussion for diffusion of radioactive materials in environment.
物理定数には啓蒙書があります。
西條敏美「物理定数とは何か―自然を支配する普遍数のふしぎ」blue backs, Kodansya co.ltd., 1996.10.1.
内容:
物理「定数」は、新知見を物理にもたらした。
「熱の仕事当量」から「エネルギー保存」の概念が生まれた。
「アボガドロ定数」から原子の実在が証明されました。
「リュードベリ定数」はミクロとマクロの世界を結びつけ、
「ボルツマン定数」は熱力学と統計力学を結びつけました。
There is an enlightenment book for physical constants.
Toshimi SAIJO, "What are physical constants, the mystery of universal numbers that govern nature", Blue backs, Kodansya co.ltd., October 1, 1996.
Contents:
The physical "constants" have brought new knowledge to the physics.
The concept of "Conservation of energy" was born from "Joule’s equivalent".
The existence of atom was proved from the "Avogadro constant".
"Rydberg constant" connects the micro and macro worlds
The "Boltzmann constant" combines thermodynamics and statistical mechanics.
雑談:
これらの定数の証明は,未だ成功していません。現在、言えること:値が異なると,生物は存在できなくなる。
注目されている定数: 光速c,1電子電荷e,プランク定数h,真空の誘電率ε0の比をとった定数,α=e^2/(2ε0hc)。これを「微細構造定数」という。Arnold Sommerfeldにより1916年に物理に導入された。
真空中の荷電粒子の振る舞い(ε0)を含む電磁(e)相互作用に関して,光速~相対論(c)と量子論(h)を関係づけている。α=1/137.03599976、これが宇宙のどこでも一定ですか?
Chat:
Proof of these constants has not yet been successful. Now we can say: If the values are different, the organism cannot exist.
An interesting constant: the speed of light c, the one-electron charge e, the Planck's constant h, and the constant obtained by taking the ratio of the permittivity of vacuum ε0, α = e^2/ (2ε0 hc).
This is called the "fine structure constant". Introduced in physics in 1916 by Arnold Sommerfeld, Ph. Dr.
Regarding the electromagnetic (e) interaction including the behavior (ε0) of charged particles in a vacuum, the speed of light-relativity (c) and quantum theory (h) are related. α = 1 / 137.03599976; Is the constant same anywhere in universe?
環境中の放射性Csの減衰関数を求めます。
2013年3月29日を起点日とした経過日150~520日(降雪時を除く)の線量率の理論値と実測値の差のアフィン変換値をプロットします。
いままでジグザグ曲線で描いてきましたが、それはグラフを見やすくするためです。本当は点々で描くべきです。そうして点の集合を近似する関数形を見つけます。
We try to find decay functions of radioactive Cs in the environment.
Plot the affine transformation value of the difference between the theoretical value and the measured value of the dose rate for the elapsed days 150 to 520 days (excluding snowfall days) starting from March 29, 2013.
Until now, we have drawn zigzag curves, but that is to make the graph easier to see. The truth is that we should draw in dots. Then find a functional form that approximates the set of points.
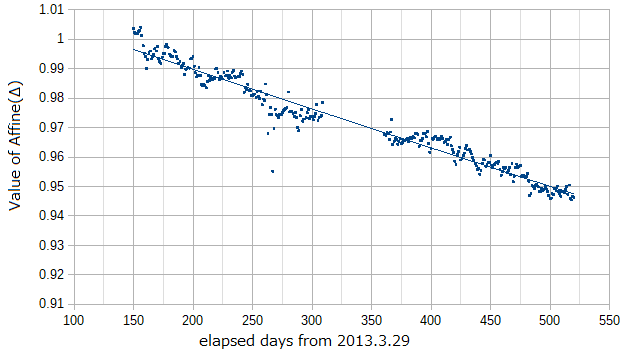
直線関数と仮定します。"y=-0.0001327d+1.1016, R2=0.953"を得ます.
指数関数と仮定します。"y=1.017exp(-0.0001365d),R2=0.954"を得ます.
2次関数と仮定します。"y=7.195*(10^-8)*d^2-0.0001809d+1.00234, R2=0.955".
対数関数と仮定します。"y=-0.04104Ln(d)+1.2077, R2=0.952".
決定係数(R2)は同じとみなせます*。どの仮定関数も採用できます**。実線がそれらの関数です。
"d=Ln(0.5)/A"なので、"A=-0.0001365"ならば"d=5079days=14Year"です。この半減期はamp=10の下で、この値になっています。後で本当の半減期を計算します。
*) 指数関数のマクローリン展開を考えれば第1項までで十分ということです。
一般則を言うと、どちらも採用できる場合は簡単な式を選ぶべきです。これは経験的な法則で「オッカムのカミソリ」と言われています。それは現象の予測をするときに重要です。
結論: この経過日の間の線量の低下は、放射性物質がその場を動かないで自然崩壊しているのでは無く、移動しています。
Suppose it is a linear function. Get "y = -0.0001327d + 1.1016, R2 = 0.953".
Suppose it is an exponential function. Get "y = 1.017exp (-0.0001365d), R2 = 0.954".
Suppose it is a quadratic function. "y = 7.195 * (10 ^ -8) * d ^ 2 -0.0001809d + 1.00234, R2 = 0.955".
Suppose it is a natural logarithmic function. "y = -0.04104Ln (d) + 1.2077, R2 = 0.952".
The coefficient of determination (R2) can be considered the same *. Any assumption function can be adopted **. The solid lines are those functions.
Since "d = Ln (0.5) / A", if "A = -0.0001365", then "d = 5079days = 14 Year". The half-life is at the value based on "amp=10". We will re-calculate the true half-life later.
*) Considering the Maclaurin series of the exponential function, the first term is sufficient.
As a general rule, if both can be adopted, you should choose a simple formula. This is an empirical law called "Occam's razor". It is important when you predict the phenomenon.
**) Why do you assume those 4 functions?
It is from the concept of variational method. Suppose a function f (x) for a variable x is defined. The change (d/dx)f (x) of the function value with respect to the minute change δx of the variable is called the derivative.
An extension of this idea, the variable x is regarded as a constant, and a small change (Δ/Δf)f (x) in the function form is considered.
A linear function would be 2 or 0.5, and an exponential function is the natural logarithm of the inverse function. The generalization of considering the functions around the defined function is called "the functional".
You will study the functional and variational method in a specialized course.
Conclusion: The decrease in dose during the elapsed days is NOT that the radioactive material is stopping and spontaneously collapsing, but that it is moving.
環境中の放射性Csの減衰関数の概要が判明しました。
今度は、実測値のスケールで同減衰関数を3区間に分割して調べます。
区間1: 2013年3月29日を起点日とした経過日150~520日(2014.8.30)
区間2: 経過日521~1583日(2017.7.28)
区間3: 経過日1584~2905日(2021.3.11)。
以上3区間で、降雪時の測定を除く。
3分割の理由: 測定値をプロットして、変化に段差がある日を選定する。
ここで恣意的な操作が入っています。これを避けるため、Leave-one-out法*を考えて見ます。
We discussed an overview of the decay function of radioactive Cs in the environment; So, we recalculate the decay. This time, we examine the decay function by dividing it into 3 sections on the scale of measured rates.
Section 1: Elapsed days 150 to 520 days starting from March 29, 2013 (520 eDay=2014.8.30)
Section 2: Elapsed days 521 to 1583 days (1583 eDay=2017.7.28)
Section 3: Elapsed date 1584-2905 days (2905 eDay=2021.3.11).
In the 3 sections, measurements during snowfall are excluded.
Reason for 3 divisions: Plot the measured values and select the day when there is a step in the change. Arbitrary operations are included here. To avoid it, consider the Leave-one-out method*.
*) 測定値の集合を{Obs}とします。
その部分集合を{p}として、{Obs}-{p}から近似関数を作る。
近似関数の決定係数をR2(0)とする。
近似関数で{p}に相当する集合{q}を計算する。
{p}と{q}の差から決定係数R2(1)を計算する。
R2(0)<R2(1) ならば{p}を作った、経過日は無意味である。
R2(0)>R2(1)ならば同経過日は有意である。
以上が、Leave-one-out法です。趣旨は明解です。
しかし、線量値のように値が細かく振動していると、この方法では巧くいかないことが分かるでしょう。
それで、恣意的なグラフを描いて、線量値の変化の段差を恣意的に2か所選定しました。
Let {Obs} be the set of measurements.
Let the subset be {p} and create an approximate function from {Obs}-{p}.
Let R2 (0) be the coefficient of determination of the approximation function.
Calculate the set {q} corresponding to {p} with the approximation function.
Calculate the coefficient of determination R2 (1) from the difference between {p} and {q}.
If R2 (0) <R2 (1), then {p}-created elapsed date is meaningless.
If R2 (0)> R2 (1), the elapsed date is significant.
The above is the Leave-one-out method. The purpose is clear.
However, if the value vibrates finely, such as the dose rates, you will find that this method does not work.
Therefore, we drew an arbitrary graph and arbitrarily selected 2 steps of the change in the dose rates.
結果:
区間1: y=0.3723exp(-0.0008045d), R2=0.987; Half-lie=2.36Y.
区間2: y=0.29384exp(-0.0003858d), R2=0.978; Half-life=4.92Y.
区間3: y=0.20923exp(-0.0001854d), R2=0.945; Half-life=10.2Y.
半減期の変化から、放射性物質の(土壌中の)移動が遅くなっている、ことが分かります。土壌がCsを強く吸着していれば、この動きは妥当です。
Result:
Section 1: y = 0.3723exp (-0.0008045d), R2 = 0.987; Half-life = 2.36 Y.
Interval 2: y = 0.29384exp (-0.0003858d), R2 = 0.978; Half-life = 4.92Y.
Section 3: y = 0.20923exp (-0.0001854d), R2 = 0.945; Half-life = 10.2Y.
The change in half-life shows that the movement of radioactive material (in the soil) is slowing down. The move is reasonable if the soil strongly adsorbs Cs.
演習: 放射性の核の情報は下記DBにあります。アクセスしてください。
Exercise: Information on radioactive nuclei can be found in the following DB. Please access.
DB: URL: https://www.nndc.bnl.gov/nudat2/
The contents:
"NuDat 2" is a software that allows users to interactively search and plot nuclear structure and nuclear decay data.
"NuDat 2" provides an interface between web users and several databases containing nuclear structure, nuclear decay and some neutron-induced nuclear reaction information. There are three different search forms: one for levels and gammas, a second one for decay-related information, and a third one for searching the Nuclear Wallet Cards file. "NuDat 2" was developed by the National Nuclear Data Center (NNDC).
NuDat 2は、ユーザーが核構造と核崩壊データをインタラクティブに検索してプロットできるようにするソフトウェアです。
NuDat 2は、Webユーザーと、核構造、核崩壊、およびいくつかの中性子誘起核反応情報を含むいくつかのデータベースとの間のインターフェースを提供します。 3つの異なる検索フォームがあります。1つはレベルとガンマ用、2つ目は崩壊関連情報用、3つ目はNuclear Wallet Cardsファイルの検索用です。 NuDat 2は、国立核データセンター(NNDC)によって開発されました。
Let's input "Cs-137" & push Go-button.
Results:
Ground and isomeric state information for 137,55,Cs;
T1/2 (Half-life), 30.08Y, β-: 100%
Click, "decay radiation information".
Cs-137-->100%-->Ba-137
Beta-: see Dose-column, the intensity is max. 0.1651[Mev/Bq-s], that is small.
See "Gamma and X-ray radiation", the maximum intensity is 661.657 keV, 85.10%, Dose 0.5631. This is main radiation.
< しばらく原子核の講義です >
原子核は陽子と中性子から構成される。
原子核の大きさ(10-15 m)は原子の大きさ(10-10 m)に比べて小さい。
核力(強い相互作用)は短距離で働く引力であり、原子核を構成している中性子と陽子を束縛する。
不安定な原子核は、α崩壊、β崩壊により放射線(γ線)の放出を伴い安定原子核へ崩壊する。
電荷を持たない中性子は、原子核に接近できる。
原子核は離散的なエネルギー励起状態を持つ。
統一原子質量単位(unified atomic mass unit) 1u=1.66054×10^-27 kg
陽子、静止質量=1.007276u; 中性子、同質量=1.008665u.
原子核を構成する核子の質量総和と原子核の質量の差を質量欠損(mass defect)と呼ぶ。
相当するエネルギーを、核種の結合エネルギー(binding energy)という。
単位: electron volt、eV、1 eV=1.60217733×10^-19 J)。
結合エネルギーは、質量数が60 まで増加し、以降、減少する。
< Atomic nucleus lecture >
The nucleus is composed of protons and neutrons.
The size of the nucleus (10^-15 m) is smaller than the size of the atom (10^-10 m).
Nuclear force (strong interaction) is an attractive force that works over a short distance and binds the neutrons and protons that make up the nucleus.
Unstable nuclei decay into stable nuclei with the emission of radiation (γ-rays) due to α decay and β decay.
Uncharged neutrons can approach the nucleus.
The nucleus has discrete energy excited states.
Unified atomic mass unit 1u = 1.66054 × 10 ^ -27 kg
Proton, rest mass = 1.007276u; Neutron, same mass = 1.008665u.
The difference between the total mass of the nucleons that make up the nucleus and the mass of the nucleus is called a mass defect.
The corresponding energy is called the binding energy of the nuclide.
Unit: electron volt, eV, 1 eV = 1.60217733 × 10 ^ -19 J).
The binding energy increases to a mass number of 60 and then decreases.
β-崩壊(beta decay):
原子核から電子(β線)と反電子ニュートリノが放出される。
原子核中の1中性子が陽子に変わる。
β+崩壊: 陽電子と電子ニュートリノが放出される。
原子核中の1 陽子が中性子に変わる。
α崩壊、alpha decay: He-4 (アルファ粒子)を放出する。
α崩壊では質量数が4、原子番号が2減少する。
α、β崩壊により原子核が励起状態になったとき、γ線(gamma ray)を放出する。核は低エネルギー状態へ遷移する。
γ線遷移で陽子・中性子数は変化しない。同遷移は短時間である。
長半減期の励起状態を有する核が存在する。本状態を準安定状態(metastable state)と呼ぶ。
そのような核種の励起状態を核異性体(isomer)と呼び、基底状態と区別するために質量数にm を追加して表記する。
この励起状態から基底状態へのγ線遷移をisometric Transition: IT)と呼ぶ。
"β-" decay:
Electrons (β rays) and anti-electron neutrinos are emitted from the nucleus.
One neutron in the nucleus turns into a proton.
"β+" decay: Positrons and electron neutrinos are emitted.
One proton in the nucleus turns into a neutron.
Alpha decay: Emits He-4 (alpha particles).
Alpha decay reduces the mass number by 4 and the atomic number by 2.
When the atomic nucleus is excited by α and β decay, it emits γ-rays (gamma ray).
The nucleus transitions to a low energy state.
The number of protons and neutrons does not change due to γ-ray transition. The transition is short.
There are nuclei with long half-life excited states. The state is called a metastable state.
The excited state of such a nuclide is called the nuclear isomer, and m is added to the mass number to distinguish it from the ground state.
This γ-ray transition from the excited state to the ground state is called isometric Transition (IT).
α崩壊では質量数が4 減少する。
Pb-208 よりも重い不安定核種は崩壊して、質量数が4 つとびに減少する。
ゆえに、4系列(トリウム、ネプツニウム、ウラン、アクチニウム系列)が存在する。
全系列はPb の安定同位体で崩壊を終了する。
起点となる親核種はTh-232(1.405×10^10 Y)、Np-237(2.144×10^6 Y)、U-238(4.468×10^9 Y)、U-235(7.038×10^8 Y)。
The mass number decreases by 4 in the alpha decay.
Unstable nuclides heavier than Pb-208 decay and their mass numbers are reduced to four.
Therefore, there are four series (thorium, neptunium, uranium, actinium series).
The entire sequence terminates decay with a stable isotope of Pb.
The starting parent nuclides are Th-232 (1.405 × 10 ^ 10 Y), Np-237 (2.144 × 10 ^ 6 Y), U-238 (4.468 × 10 ^ 9 Y), U-235 (7.038 × 10 ^). 8 Y).
原子構造(Atomic structure):
元素の周期律表(periodic table):=電子数と元素の化学的性質の関係
原子は中心に正電荷をもつ原子核があり,電子は原子核がつくるCoulomb ポテンシャルによって束縛さる。
電子の存在・状態として、1粒子軌道上の近似が成り立つ*。
電子はFermi 粒子である。1状態に1粒子だけ存在し得る.
電子数が2, 10, 18, 36, 54, 86 のときに、「閉殻(Closed shell)」を成す**。
閉殻より1電子が多いとき,化学的に活性なアルカリ金属になる。セシウムがそうです。
小エネルギーを加えるだけで1価の陽イオン(Cs+)になる.
*) 原子核は電子数と同じ正の電荷を持ち、電子の分布位置より小さい空間に存在する。その正電荷を注目している電子以外の電子群が覆っている。
そうすると、注目している1個の電子は、1正電荷の核の周りを恒久的に運動している、と考えられる。
これを電子の平均場近似mean field approximation の1電子モデルという。
**) この数列の背景にある物理は、角運動量Angular momentum、という概念である。角運動量を議論するには球面調和関数、ルジャンドル陪関数を学ぶ必要がある。
専門課程の量子力学の講義を聞いてください。
電子数が2,10,18になる理由は書いておきます。
電子の動径関数から1,2,3,...
角運動量関数からs(1),p(3),d(5),....。この(n)は独立の関数の数です。
ゆえに{1s}, {2s,2p}, {3s, 3p, 3d}軌道に電子は{2},{2+3*2=8}.{2+3*2+5*2=18}個、存在できます。
Atomic structure:
Periodic table of elements: = Relationship between the number of electrons and chemical properties of atoms.
Atoms have a positively charged nucleus in the center, and electrons are bound by Coulomb potential created by the nucleus*.
As the existence and state of electrons, an approximation on one particle orbit holds.
Electrons are the Fermions. Only one particle can exist in one state.
When the number of electrons is 2, 10, 18, 36, 54, 86**, it forms a "closed shell".
When there are one more electron than the closed shell, it becomes a chemically active alkali metal. Cesium is so.
It becomes a monovalent cation (Cs+) just by adding a small amount of energy.
*) Atomic nucleus has same positive charges as the number of electrons and exists in a space smaller than the distribution radius of electrons.
The positive charge is covered by a group of electrons other than 1 target electron. Then, it is considered that the 1 electron of interest is permanently moving around the nucleus of one positive charge. This is called a one-electron model on the mean field approximation of electrons.
**) The physics behind the sequence is the concept of angular momentum.
To discuss the angular momentum, it is necessary to learn the spherical harmonics, the Legendre polynomials, and the associated function.
Listen to a lecture on quantum mechanics in a specialized course.
I write the reason why the number of electrons is 2, 10, and 18.
From the radial function of electrons, we get {1,2,3, ...}-radial functions
From the angular momentum function, s (1), p (3), d (5), ... The (n) is the number of independent functions.
Therefore, there are {2}, {2 + 3 * 2 = 8}, {2 + 3 * 2 + 5 * 2 = 18} electrons in the {1s}, {2s, 2p}, {3s, 3p, 3d} orbitals.
原子核も原子と同様に殻構造(Nuclear structure)をもつ可能性がある。1930 年代に議論された。しかし、原子核は中心がない。
原子内の核と電子の作用力が電磁気力(Electromagnetic force)であるのに対して,原子核子の間は「強い相互作用(Strong interaction)」である。
始めは原子核全体を「連続体(Continuum)である液滴」と考えた。
放射性核が多く発見され、結合エネルギーが測定された。その系統性を示す「魔法数」の存在は、核構造の存在を示唆していた。
1949 年,M.G. Mayer、Johannes Hans Daniel Jensenは原子核の魔法数を説明する「殻模型」を提唱した。
磁気双極子モーメントの説明などを経て,核子の1粒子軌道描像*に基を置く、殻模型が原子核模型として確立した。
*) 電磁気力で記述される原子核・正電荷と多電子系の状態は、平均場近似の下での1電子モデルに近似的に帰着する。
強い力の下でも、多体の陽子、中性子系の状態が同様に1粒子モデルに帰着する。
これは興味深いです。陽子と中性子を結合させる「何か」が存在するように考えられます。
Atomic nuclei may have a nuclear structure as well as atoms, which were discussed in the 1930s.
However, the nucleus has no center.
The force of action between the nucleus and the electron in the atom is the electromagnetic force, while the force between nuclei is the "strong interaction".
At first, we thought of the whole nucleus as a "continuum droplet".
Many radioactive nuclei were discovered and the binding energy was measured.
The existence of "magic numbers" indicating its systematicity suggested the existence of nuclear structures.
In 1949, M.G. Mayer and Johannes Hans Daniel Jensen proposed a "shell model" to explain the magic numbers of atomic nuclei.
After discussing the magnetic dipole moment, a shell model based on a one-particle orbital drawing of a nucleon was established.
*) The nuclear / positive charge and multi-electron system states described by electromagnetic force are approximately reduced to a one-electron model under mean field approximation.
Even under strong force, the states of many-body protons and neutrons are similarly reduced to the one-particle model.
It's interesting. It seems that there is "something" that binds protons and neutrons.
Under the quantum mechanics, the nucleus image is following:
A "gluon" is an elementary particle that acts as the exchange particle (or gauge boson) for the strong force between quarks. It is analogous to the exchange of photons in the electromagnetic force between two charged particles. They "glue" quarks together, forming hadrons such as protons and neutrons.
福島原発事故の処理水問題で話題のトリチウム(T)について調べましょう。
Tは"H-3"です。
半減期12.32Yで、T、スピン1/2+、18.59keVの状態が、β線(電子)を放出して、He-3、スピン1/2+の状態になる。
確率は100%、mean beta- doseは 0.00568 MeV/Bq-s。
γ線は放出しないです。
Cs-137とは違い、この放射性核種では外部被ばくは無視できます。
内部被ばくの場合でもdose値が小さいです。
各国の原発で希釈して「海に放流している」理由がこれです。
Let's find out about tritium (T), which is a hot topic in the treated water problem of the Fukushima nuclear accident.
T is "H-3".
With a half-life of 12.32Y, the T, spin 1/2+, and 18.59keV states emit β-rays (electrons) and become He-3, spin 1/2+ states.
The probability is 100% and the mean beta-dose is 0.00568 MeV / Bq-s.
It does not emit gamma rays.
Unlike Cs-137, external exposure is negligible for this radionuclide.
The dose value is small even in the case of internal exposure.
This is the reason why it is diluted at the nuclear power plants of each country and "released into the sea".
-- End of the lecture --
放射性Csの土壌中の移行を考えます。
土の中を物質が「下へ移っていくこと」をシミュレーションします。
1.崖の断面を見ると層状です。土の中も層状である、と仮定します。
2.実際に地面を垂直方向に1.5~2mくらい掘ってみましょう。
3.掘ってみましたか?50cmまではスコップで誰でもできます。
深度70cmを超えると周りから土が崩れてきて、スコップでは不可能です。
それで、ダブル・スコップという穴掘り専用の農具を使います。
これで直径20~25cm、少なくとも深度1.5mまで掘ってください。半日以上は必要です。
4.深度1m以上は大変ですね。それとスコップの研削面に粘土が付着して、毎回それをヘラで、そぎ落とす必要があったでしょう。
ある場所では水が出てきたでしょう。地下水面に到達したのです。
地下水面の深度データは地方自治体が持っています。
それと比較すると、違うでしょう。地下水面は変動しているのです。
これが土の中の状況です。みなさんも是非、実体験してください。
Let's consider a transfer-process of radioactive Cs in the soil.
It simulates the "moving down" of a substance in the soil.
1. Looking at the cross section of a cliff, it is layered. Suppose the soil is layered also.
2. Let's actually dig the ground vertically for about 1.5 to 2 m.
3. Have you tried digging? Anyone can use a shovel up to 50 cm.
If the depth exceeds 70 cm, the soil will collapse from the surroundings, which is impossible with a shovel.
That's why we use a double scoop, a farming tool dedicated to digging holes.
Now dig up to a diameter of 20-25 cm and a depth of at least 1.5 m. It takes more than half a day.
4. Depth of 1m or more is difficult. Also, the clay would have adhered to the ground surface of the shovel and would have had to be scraped off with a spatula each time.
Water would have come out in some places. It reached the groundwater surface (water table).
The local government has the depth data of the water table.
Compared to that, it will be different. The water table is fluctuating.
This is the situation in the soil. Please come and experience it.
5.放射性Csが、存在層から1つ下の層へ移行する変化量、を考えます。
存在量をxとすると、存在層では、x(1)=x(0)-δx, 下層ではy(1)=y(0)+δx、です。放射性Csの濃度は、ベクレル値であらわすと大きいですが、モル値にすれば微小量です。同物質を動かす主体は、水の上から下への流れです。
ゆえに、δ∝x(0), ここでは、δ=x(0)exp{-A*(time-step)}とします.Aは定数(パラメータ)。
ここでtime-stepについて: シミュレーションを「状態を1stepごとに進行させる」形でコーディングする。
We consider the amount of change in which radioactive Cs shifts from the existing layer to the next lower layer.
Assuming that the abundance is x, x (1) = x (0) -δx in the abundance layer and y (1) = y (0) + δx in the lower layer. The concentration of radioactive Cs is large when expressed in Becquerel unit, but it is very small when expressed in molar value. The driving body that moves the substance is the water-flow from upper to lower layers.
Therefore, δ∝x (0), here δ = x (0) exp {-A * (time-step)}. A is a constant (parameter).
Where, definition of the time-step: we code the simulation in the form of "advancing the state step by step".
6.層数を9層としました。各層の厚さは同じです。
最下層(第9層)は特別で、その層の放射性Csはそこに留まります。
無限stepでは、放射性Csは第1層から第9層へ移行します。移動距離は1m。
その途中の状況をシミュレーションします。
想定した、各層の厚さは10cmです。
The number of layers is set to 9. The thickness of each layer is the same.
The bottom layer (9th layer) is special, and the radioactive Cs in the layer stays there.
In the infinite step, radioactive Cs migrates from the 1st layer to the 9th one. The moving distance is 1m.
We simulate situations along the way. The assumed thickness of each layer is 10 cm.
7.地上でradiative dose rateを計測するので、各層からのγ線量を積算します。
土は空気よりもγ線を吸収するので、Γ(t)=Σ(i=1,9){x(i;t)exp(-Bi)}, B=const.>0, とし、各time stepのΓ(t)を計算します。
B=0(空気)ならばΓ(t)は、移動しない放射性Csの自然崩壊曲線と同じです。
放射性Cs は自然崩壊しているので、各step毎に"x(i,step#+1)=x(i,step#)exp(-C), C=const., i=layer#" とします。
以上、このシミュレーションではA~Cの3パラメータが必要です。
Since the radiative dose rate is measured on the ground, the γ dose from each layer is integrated.
Since soil absorbs γ-rays more than air, we set "Γ(t)=Σ(i=1,9) {x (i; t) exp (-Bi)}", "B=const. > 0"; and the simulator calculates Γ(t) per a step.
If B=0 (air), Γ (t) is the same as the spontaneous decay curve of non-moving radioactive Cs.
Since radioactive Cs decays spontaneously, we set "x (i, step # + 1) = x (i, step #) exp (-C), C = const., i= layer #" for each step.
As mentioned above, 3 parameters A to C are required for the simulation.
8.パラメータを;
A=0.1 ! sedimentation ratio,
B=0.1 ! 0(non); Soil shielding coefficient,
C=-alog(0.5)/(365.25*0.5) ! HL=0.5Y, per a step(1day),
とした場合のシミュレーション結果を示します。
A = 0.1! Sedimentation ratio
B = 0.1! 0 (non); Soil shielding coefficient
C = -alog (0.5) / (365.25 * 0.5)! HL = 0.5Y, per a step (1day)
The simulation result is shown below.

本図はシミュレーション期間0~736stepの365step部分を拡大したものです。
赤線:第1層のCs+量、
緑線:第3層のCs+量、
青線:放射線量、この指数近似を、赤点線、f(x)とする。
青線と赤点線の曲率の変化に注目する。
福島県県北保健センターの実測値と変化形が似ている。
こういう確認作業を「モデル化と計算の途中」で行って、採用モデルが現実と離反しない、ことを実施してください。
これから、学生さんたちは、専門課程に進み、卒業研究をします。そのときに現象の測定をします。そして、それらからモデルを演繹します。自分で考えて、演繹するのです。その練習です。
私のモデル構築法: 測定結果を色々なスケール(時間方向、軸の対数化、など)で表す。
基準となる関数(指数関数、ガウス関数、ガンマ関数、対数、べき乗、シグモイド関数,..)の一部に、測定結果のプロット列が似ていないか、を調べる。
似ている部分を、どうやって基準関数から導けるか、をプログラミングして、試行する。

本図が、全期間0~736stepのグラフです。
第9層(last layer)のCs+量に注目する。その層から下層に浸透しないのでガンマ関数のような増減となる。
This figure is an enlargement of the 365 step part of a model-simulation period 0 to 736 step.
Red line: Cs + amount of 1st layer,
Green line: Cs + amount of the 3rd layer,
Blue line: Radiation amount, dose rates, the exponential approximation is a red dotted line, f (x).
Notice the change in curvature of the blue and red dotted lines.
The variation likes to the measured dose rates at Fukushima prefectural Kenpoku health center.
Perform this kind of confirmation work "in the middle stage of modeling and calculation" so that the adopted model does not deviate from facts.
From now on, students will go on to specialized courses and do a graduation research. At that time, you measure phenomenon. Then you deduce the model from them by you own. That is the practice.
My model construction method:
1. Express measurement values on various scales (time direction, logarithmization of axes, etc.).
2. Check if the plot sequence of the measurements is similar to some of the reference functions (exponential-, Gaussian-, Gamma-, Logarithmic-, Sigmoid- functions).
3. Program and try how to derive/fit to the parts from one of the reference functions.
The figure is a graph of 0 to 736 steps for the entire period.
Pay attention to the amount of Cs + in the last layer. Since it does not penetrate from the layer to lower layers, it changes like the gamma-function.

最終層は地下水面内の粘土層と考えています。
その層では、水平方向に、緩やかな水の流れ*があり、放射性Cs+が移動すると考えます。
*) 土地の傾斜が無ければ、流れは無視できる、でしょう。傾斜があれば、地下水は動く、と考えます。そのシミュレーション試行します。
単純化したモデルでは;最下層にだけ、周囲に存在する放射性Cs+が一定の速度(:=Din)で、流入する。
これは山域のくぼ地を考えています。
x(Last)=x(Last)+Din.
Dinはパラメータです。今回はDin=A/1000=O(-3)、Din=A/100=O(2)の2casesについて計算します。結果を示します。
”O()”はorderの意味です、()内の数字は10のべき乗の絶対値、符号"-"は減少、"なし"は増加です。この書き方は、ここだけの話です。
The last layer is a clay layer in the underground water table.
In the layer, there is a few flow of water* in the horizontal direction, and it brings radioactive Cs+.
* If there is no slope of the land, the flow would be negligible.We believe that if there is a slope, the groundwater moves.
Let's try such a migration-simulation.
As a simplified model, only in the last layer, the surrounding radioactive Cs + flows into at a constant velocity (: = Din).
This is thinking of a dent place in the mountains.
x (Last) = x (Last) + Din.
The Din is a parameter. This time, we calculate for 2 cases of Din = A/1000 = O(-3) and Din = A/ 100 = O(2).
"O ()" means order, the number in () is the absolute value of the power of 10, the sign "-" is decreasing, and "none" is increasing. This way of writing is only here.
The result is shown.
この2図はO(-3),O(2)に対応します。
O(-3)では、migrationの効果で放射線量の減衰が遅くなるだけです。
これならば、除染の効果は減じますが、実害はないです。O(2)では、放射線量の低下が80step以降、増加に転じ、最終的には初期値より大きくなります。
福島県県北保健センターの除染後の線量値低下について論じてきましたが、
地下水面にある層の放射性Cs+の移動によっては、除染が無効になってしまう場合も考えられる、ということです。
ゆえに、山地の斜面にある地域、とくに窪地の除染には、地下の状況を良く調査しまないといけないです。
These 2 figures correspond to O (-3) and O (2) cases.
At O (-3), the effect of migration only slows down attenuation of radiation doses.
This reduces a decontamination effect, but it is NOT cause any harm. In O(2), the decrease in radiation dose starts to increase after 80 simulated steps, and finally becomes larger than the initial one.
We have discussed the decrease in dose rates after decontamination at Fukushima prefectural Kenpoku health center.
Decontamination may be invalidated by movement of radioactive Cs+ in the water table.
Therefore, in order to decontaminate areas on the slopes of mountains, especially depressions, it is necessary to carefully research the underground conditions.
これまでの記述の論理的な確認と反省:
土中の垂直方向の物質移動が存在する。その移動原因が水である、ことは不自然でない。
しかし、その移動速度が測定されて、かつシミュレーションのパラメータと関連付けられていない。
土の中の層は物質の垂直移動の差分化の作用をしている。
最下層だけが他の層と「物質移動に関する性質」が異なる。これは実質的に土壌を2層で表している。
土の中を「水による物質の垂直移動」「物質の滞留と水平移動」層で近似している、それは粗い近似である。
Logical confirmation and reflection of above descriptions:
There is vertical mass transfer in the soil. It is acceptable that a cause of the movement is water.
However, its movement speed has not been measured and is not related with simulation parameters.
The layers in the soil act to express vertical movement of matter.
Only the bottom layer differs from the other layers in "mass transfer properties". This effectively represents the soil in 2 layers.
It is a rough approximation of the "vertical movement of matter by water" and "retention and horizontal movement of matter" in the soil.
これまでの記述の利点:
(1) 行政の放射線量サイトがある。
http://www.atom-moc.pref.fukushima.jp/public/map/MapMs.html
そこには1年以内の福島県内の放射線量の実測値が記載されて、グラフ化もされている。しかし5年以上にわたる長期間の変化がない。行政はそういうデータを持っているのに、専門的すぎる、として一般にアクセスできるようにはしていない。本Noteは、それを補っている。
(2) 実測値のデータ解析に止まらず、その結果から放射性物質の動きに言及している。そのアプローチは教養課程の学生が習得して損が無い。
本論では; 土中の物質移動の実測とのフィッティングが為されていない、ので、将来の放射線環境を予測しえない。しかし、ここでのアプローチはフィッティングさえ為されれば、将来を予測できる。他地点の除染可能性、の検討法にも応用できる。
Advantages of the descriptions so far:
(1) There is an administrative radiation dose site.
http://www.atom-moc.pref.fukushima.jp/public/map/MapMs.html
The actual measurement dose rates of the gamma-radiation in Fukushima prefecture within one year are displayed there, and they are also graphed.
However, there has been no long-term change over 5~7 years.
The government has such data, but does not make it accessible to the public as being too specialized. The Note makes up for that.
(2) Not only the data analysis of the measured values, but also the movement of radioactive materials is mentioned from those results. There is no loss in learning that approach for liberal arts students.
In this Note; it is not possible to predict the future radiation environment because it is not fitted with the actual measurement of mass transfer in the soil. However, the approach here can predict the future as long as the fitting is done. It can also be applied to the examination method of decontamination possibility at other points.
この記事が気に入ったらサポートをしてみませんか?