
Excel File有り 国別現代奴隷人数ワーストランキング(WFF2018年発表 2016年調べ)⚫︎人口比率ではなく奴隷人数順に並べて変えました⚫︎167ヵ国ワーストランキング(エクセルファイル有ります)

エクセルファイルを作りました。下記のエクセルファイルをダウンロードしてお使い下さい⬇︎
【現代奴隷ワースト20 WFF2018年発表2016年調べ】
順位 国名 現代奴隷人数 人口
1 Indiaインド 7,989,000 1,309,054,000
2 China中国 3,864,000 1,397,029,000
3 Pakistanパキスタン3,186,000 189,381,000
4 Korea,N北朝鮮 2,640,000 25,244,000
5 Nigeriaナイジェリア1,386,000 181,182,000
6 Iran イラン 1,289,000 79,360,000
7 nesia インドネシア 1,220,000 258,162,000
8 Congo コンゴ 1,045,000 76,197,000
9 Russia ロシア 794,000 143,888,000
10 Philippin フィリピン784,000 101,716,000
11 Afghanistanアフガン749,000 33,736,000
12 Ethiopia エチオピア 614,000 99,873,000
13 Thailandタイ 610,000 68,658,000
14 Bangladeshバン592,000 161,201,000
15 Myanmarミャン575,000 52,404,000
16 Egyptエジプト 518,000 93,778,000
17 Turkey トルコ 509,000 78,271,000
18 Sudan スーダン 465,000 38,648,000
19 Eritrea エリトリア451,000 4,847,000
20 VietNam ベトナム 421,000 93,572,000
現代奴隷累計表(167ヵ国)
ワーストランキング22位までで現代奴隷の75%を占めています。
1〜22位累計奴隷数30,512,000人 75.92%
(人口累計 4,816,329,000人 '65.40%)


現代奴隷人数167ヵ国ランキング表


現代奴隷167ヵ国ランキング(メモベース)
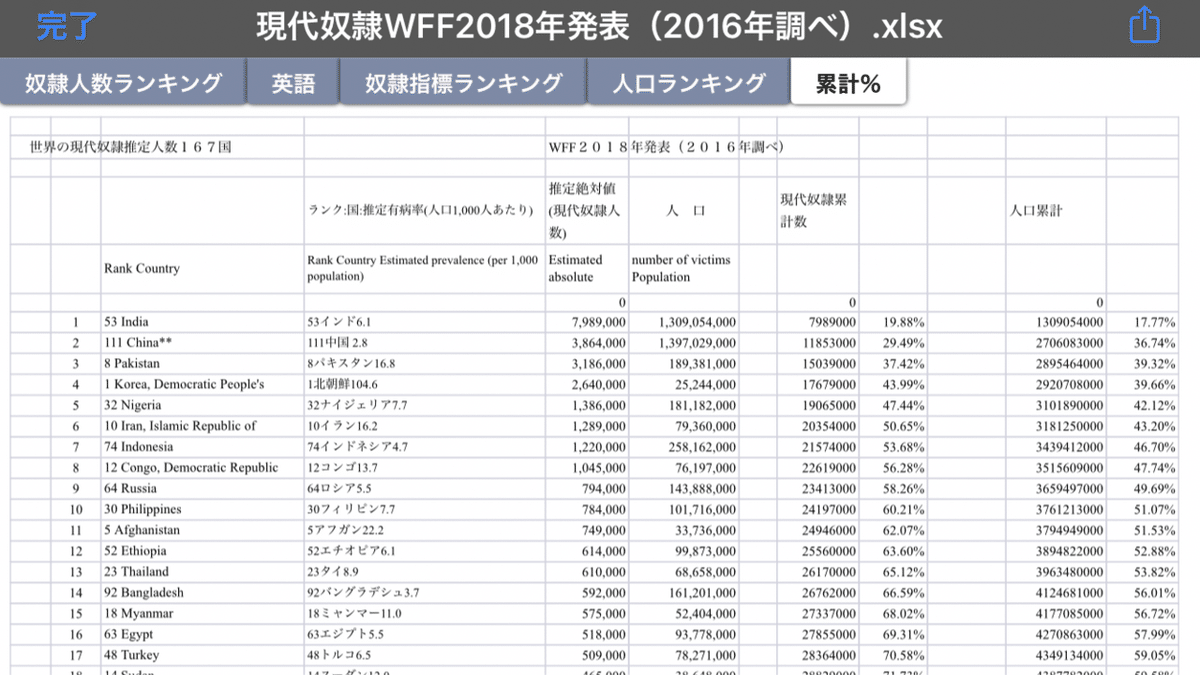
167国 WFF2018年発表(2016年調べ)
ランク:国:推定有病率(人口1,000人あたり)
推定絶対値(現代奴隷人数)
人 口
Rank Country
Rank Country Estimated prevalence (per 1,000 population)
Estimated absolute
number of victims Population
1 53 India 53インド6.1 7,989,000 1,309,054,000
2 111 China** 111中国 2.8 3,864,000 1,397,029,000
3 8 Pakistan 8パキスタン16.8 3,186,000 189,381,000
4 1 Korea, Democratic People's 1北朝鮮104.6 2,640,000 25,244,000
5 32 Nigeria 32ナイジェリア7.7 1,386,000 181,182,000
6 10 Iran, Islamic Republic of 10イラン16.2 1,289,000 79,360,000
7 74 Indonesia 74インドネシア4.7 1,220,000 258,162,000
8 12 Congo, Democratic Republic 12コンゴ13.7 1,045,000 76,197,000
9 64 Russia 64ロシア5.5 794,000 143,888,000
10 30 Philippines 30フィリピン7.7 784,000 101,716,000
11 5 Afghanistan 5アフガン22.2 749,000 33,736,000
12 52 Ethiopia 52エチオピア6.1 614,000 99,873,000
13 23 Thailand 23タイ8.9 610,000 68,658,000
14 92 Bangladesh 92バングラデシュ3.7 592,000 161,201,000
15 18 Myanmar 18ミャンマー11.0 575,000 52,404,000
16 63 Egypt 63エジプト5.5 518,000 93,778,000
17 48 Turkey 48トルコ6.5 509,000 78,271,000
18 14 Sudan 14スーダン12.0 465,000 38,648,000
19 2 Eritrea 2エリトリア93.0 451,000 4,847,000
20 77 Viet Nam 77ベトナム4.5 421,000 93,572,000
21 3 Burundi 3ブルンジ40.0 408,000 10,199,000
22 158 United States 158米国1.3 403,000 319,929,000
23 142 Brazil 142ブラジル1.8 369,000 205,962,000
24 114 Mexico 114メキシコ2.7 341,000 125,891,000
25
51 Tanzania, United Republic of
51タンザニア6.2 336,000 53,880,000
26 41 Kenya 41ケニア6.9 328,000 47,236,000
27 33 Uganda 33ウガンダ7.6 304,000 40,145,000
28 49 Ukraine 49ウクライナ6.4 286,000 44,658,000
29 9 Cambodia 9カンボジア16.8 261,000 15,518,000
30 7 South Sudan 7南スーダン20.5 243,000 11,882,000
31 11 Somalia 11ソマリア15.5 216,000 13,908,000
32 42 Malaysia 42マレーシア6.9 212,000 30,723,000
33 34 Madagascar 34マダガスカル7.5 182,000 24,234,000
34
61 Venezuela, Bolivarian Republic
61ベネズエラ5.6 174,000 31,155,000
35 72 Iraq* 72イラク* 4.8 174,000 36,116,000
36 55 Nepal 55ネパール6.0 171,000 28,656,000
37 15 Chad 15チャド12.0 168,000 14,009,000
38 134 Germany 134ドイツ2.0 167,000 81,708,000
39 69 Uzbekistan** 69ウズベキスタン5.2 160,000 30,976,000
40 44 Cameroon 44カメルーン6.9 157,000 22,835,000
41 110 South Africa 110南アフリカ2.8 155,000 55,291,000
42 67 Mozambique 67モザンビーク5.4 152,000 28,011,000
43 122 Italy 122イタリア2.4 145,000 59,504,000
44 56 Côte d'Ivoire 56コートジボワール5.9 137,000 23,108,000
45 38 Syrian Arab Republic* 38シリアアラブ共和国* 7.3 136,000 18,735,000
46 132 United Kingdom 132英国2.1 136,000 65,397,000
47 16 Rwanda 16ルワンダ11.6 134,000 11,630,000
48 46 Niger 46ニジェール6.7 133,000 19,897,000
49 71 Ghana 71ガーナ4.8 133,000 27,583,000
50 35 Malawi 35マラウイ7.5 131,000 17,574,000
51 113 Colombia 113コロンビア2.7 131,000 48,229,000
52 136 France 2.0 136フランス2.0 129,000 64,457,000
53 100 Poland 100ポーランド3.4 128,000 38,265,000
54 115 Algeria 115アルジェリア2.7 106,000 39,872,000
55 47 Zimbabwe 47ジンバブエ6.7 105,000 15,777,000
56 124 Spain 124スペイン2.3 105,000 46,398,000
57 20 Belarus 20ベラルーシ10.9 103,000 9,486,000
58 4 Central African Republic 4中央アフリカ22.3 101,000 4,546,000
59 39 Angola 39アンゴラ7.2 1 99,000 27,859,000
60 137 Korea, Republic of (South 137韓国1.9 99,000 50,594,000
61 28 Guinea 28ギニア7.8 94,000 12,092,000
62 60 Zambia 60ザンビア5.7 92,000 16,101,000
63 6 Mauritania 6モーリタニア21.4 90,000 4,182,000
64 27 Greece 27ギリシャ7.9 89,000 11,218,000
65 81 Romania 81ルーマニア4.3 86,000 19,877,000
66 103 Yemen* 103イエメン* 3.1 85,000 26,916,000
67 121 Morocco 121モロッコ2.4 85,000 34,803,000
68 76 Burkina Faso 76ブルキナファソ4.5 82,000 18,111,000
69 21 Papua New Guinea 21パプアニューギニア10.3 81,000 7,920,000
70 118 Peru 118ペルー2.6 80,000 31,377,000
71 83 Kazakhstan** 83カザフスタン4.2 75,000 17,750,000
72 17 Turkmenistan** 17トルクメニスタン11.2 62,000 5,565,000
73 22 Lao People's Democratic 22ラオス9.4 62,000 6,664,000
74 95 Mali 95マリ3.6 62,000 17,468,000
75 138 Saudi Arabia* 138サウジアラビア* 1.9 61,000 31,557,000
76 62 Haiti 62ハイチ 5.6 59,000 10,711,000
77 66 Benin 66ベナン5.5 58,000 10,576,000
78 157 Argentina 157アルゼンチン1.3 55,000 43,418,000
79 45 Togo 45トーゴ6.8 50,000 7,417,00
80 29 Libya 29リビア7.7 48,000 6,235,000
81 106 Guatemala 106グアテマラ2.9 47,000 16,252,000
82 130 Sri Lanka 130スリランカ2.1 44,000 20,714,000
83 79 Azerbaijan** 79アゼルバイジャン4.5 43,000 9,617,000
84 91 Cuba 91キューバ3.8 43,000 11,461,000
85 109 Senegal 109セネガル2.9 43,000 14,977,000
86 87 Dominican Republic 87ドミニカ共和国4.0 42,000 10,528,000
87 26 Congo 26コンゴ8.0 40,000 4,996,000
88 75 Tajikistan** 75タジキスタン4.5 39,000 8,549,000
89 123 Ecuador 123エクアドル2.4 39,000 16,144,000
90 13Mongolia 13モンゴル12.3 37,000 2,977,000
91 167 Japan** 167日本** 0.3 37,000 127,975,000
92 70 Sierra Leone 70シエラレオネ5.0 36,000 7,237,000
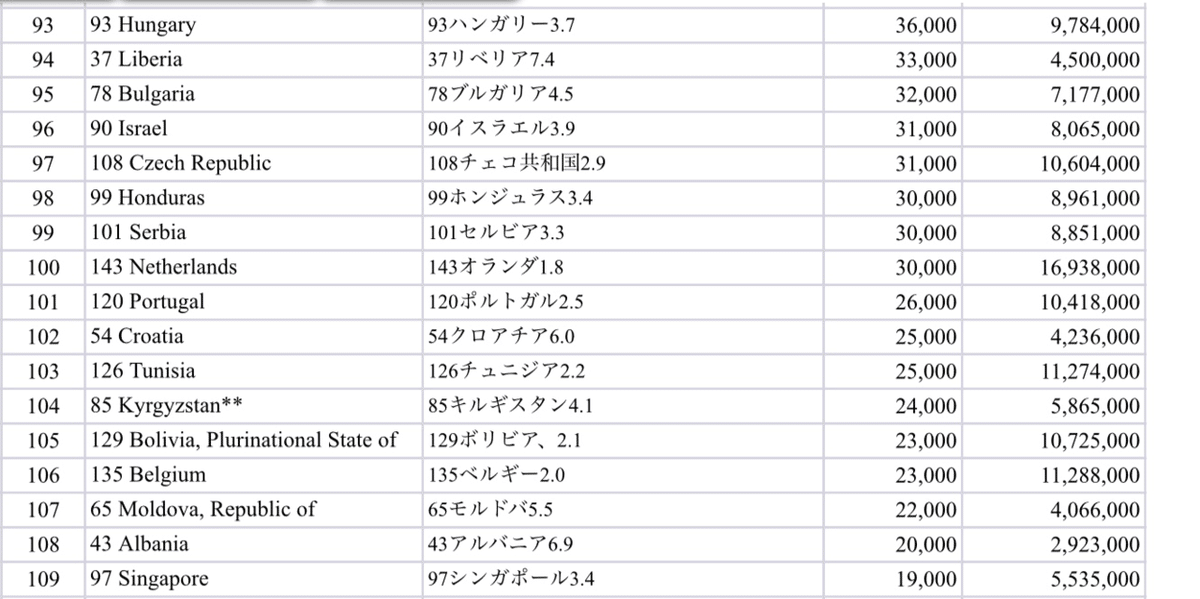
93 93 Hungary 93ハンガリー3.7 36,000 9,784,000
94 37 Liberia 37リベリア7.4 33,000 4,500,000
95 78 Bulgaria 78ブルガリア4.5 32,000 7,177,000
96 90 Israel 90イスラエル3.9 31,000 8,065,000
97 108 Czech Republic 108チェコ共和国2.9 31,000 10,604,000
98 99 Honduras 99ホンジュラス3.4 30,000 8,961,000
99 101 Serbia 101セルビア3.3 30,000 8,851,000
100 143 Netherlands 143オランダ1.8 30,000 16,938,000
101 120 Portugal 120ポルトガル2.5 26,000 10,418,000
102 54 Croatia 54クロアチア6.0 25,000 4,236,000
103 126 Tunisia 126チュニジア2.2 25,000 11,274,000
104 85 Kyrgyzstan** 85キルギスタン4.1 24,000 5,865,000
105
129 Bolivia, Plurinational State of
129ボリビア、2.1 23,000 10,725,000
106 135 Belgium 135ベルギー2.0 23,000 11,288,000
107 65 Moldova, Republic of 65モルドバ5.5 22,000 4,066,000
108 43 Albania 43アルバニア6.9 20,000 2,923,000
109 97 Singapore 97シンガポール3.4 19,000 5,535,000
110
25 Macedonia, the former Yugoslav
25マケドニア8.7 18,000 2,079,000
111 107 Nicaragua 107ニカラグア2.9 18,000 6,082,000
112 59 Lithuania 59リトアニア5.8 17,000 2,932,000
113 80 Georgia 80ジョージア4.3 17,000 3,952,000
114 141 Jordan* 141ヨルダン* 1.8 17,000 9,159,000
115 166 Canada 166カナダ0.5 17,000 35,950,000
116 68 Armenia 68アルメニア5.3 16,000 2,917,000
117 105 Slovakia 105スロバキア2.9 16,000 5,439,000
118 119 El Salvador 119エルサルバドル2.5 16,000 6,312,000
119 144 Austria 144オーストリア1.7 15,000 8,679,000
120 148 United Arab Emirates* 148アラブ首長国連邦* 1.7 15,000 9,154,000
121 152 Sweden 152スウェーデン1.6 15,000 9,764,000
122 163 Australia 163オーストラリア0.6 15,000 23,800,000
123 146 Switzerland 146スイス1.7 14,000 8,320,000
124 162 Chile 162チリ0.8 14,000 17,763,000
125 36 Guinea-Bissau 36ギニアビサウ7.5 13,000 1,771,000
126 24 Swaziland 24スワジランド8.8 12,000 1,319,000
127 98 Bosnia and Herzegovina 98ボスニア・ヘルツェゴビナ3.4 12,000 3,536,000
128 165 Taiwan, China** 165台湾0.5 12,000 23,486,000
129 58 Gambia 58ガンビア5.8 11,000 1,978,000
130 151 Paraguay 151パラグアイ1.6 11,000 6,639,000
131 31 Timor-Leste 31東ティモール7.7 10,000 1,241,000
132 145 Lebanon* 145レバノン* 1.7 10,000 5,851,000
133 156 Hong Kong, China** 156香港、中国** 1.4 10,000 7,246,000
134 73 Gabon 73ガボン4.8 9,000 1,930,000
135 84 Lesotho 84レソト4.2 9,000 2,175,000
136 128 Oman* 128オマーン* 2.1 9,000 4,200,000
137 140 Norway 140ノルウェー1.8 9,000 5,200,000
138 149 Finland 149フィンランド1.7 9,000 5,482,000
139 150 Denmark 150デンマーク1.6 9,000 5,689,000
140 88 Kosovo 88コソボ4.0 8,000 1,905,000
141 89 Latvia 89ラトビア3.9 8,000 1,993,000
142 96 Botswana 96ボツワナ3.4 8,000 2,209,000
143 102 Namibia 102ナミビア3.3 8,000 2,426,000
144 133 Panama 133パナマ2.1 8,000 3,969,000
145 147 Ireland 147アイルランド1.7 8,000 4,700,000
146 40 Djibouti 40ジブチ7.1 7,000 927,000
147 50 Equatorial Guinea 50赤道ギニア6.4 7,000 1,175,000
148 117 Jamaica 117ジャマイカ2.6 7,000 2,872,000
149 155 Kuwait* 155クウェート* 1.5 6,000 3,936,000
150 159 Costa Rica 159コスタリカ1.3 6,000 4,808,000
151 19 Brunei Darussalam 19ブルネイダルサラーム10.9 5,000 418,000
152 82 Cyprus 82キプロス4.2 5,000 1,161,000
153 94 Estonia 94エストニア3.6 5,000 1,315,000
154 127 Slovenia 127スロベニア2.2 5,000 2,075,000
155 57 Montenegro 57モンテネグロ5.9 4,000 628,000
156 104 Trinidad and Tobago 104トリニダード・トバゴ3.0 4,000 1,360,000
157 153 Qatar* 153カタール* 1.5 4,000 2,482,000
158 160 Uruguay 160ウルグアイ1.0 4,000 3,432,000
159 139 Bahrain* 139バーレーン* 1.9 3,000 1,372,000
160 164 New Zealand 164ニュージーランド0.6 3,000 4,615,000
161 86 Cape Verde 86カーボベルデ4.1 2,000 533,000
162 116 Guyana 116ガイアナ2.6 2,000 769,000
163 125 Suriname 125スリナム2.3 1,000 553,000
164 161 Mauritius 161モーリシャス1.0 1,000 1,259,000
165 112 Barbados 112バルバドス2.7 <1,000 284,000
166 154 Luxembourg 154ルクセンブルグ1.5 <1,000 567,000
167 131 Iceland 131アイスランド2.1 <1,000 330,000
合計 40189000 7356149000
4 /州が課す強制労働を含む推定有病率の最終計算ステップ1から3で概説したプロセスは、州が課す強制労働を除くすべての形態の現代奴隷制の有病率推定値を生成します。それが発生する国が課す強制労働の国家特有の兆候を考えると、それは上記のステップから除外されました。最後のステップでは、上記のプロセスから得られた推定値を、州が課す強制労働の推定値と集計します。次に、現代の奴隷制のすべての形態の有病率の最終的な見積もりが計算されます。結果の推定値を表4に示します。
特にアラブ諸国と湾岸諸国では、データにかなりのギャップがあります。これらのギャップは、この地域における現代の奴隷制の程度を大幅に過小評価していることを示しています。結果として、ここに示されている国レベルの推定値は非常に保守的であると見なされており、慎重に解釈する必要があります。 **モンゴルを除いて、(i)対面でのみ実施される、(ii)調査のみが実施されるなどの理由で調査を実施できない中央アジアおよび東アジアの小地域では、データにかなりのギャップがあります。多くの移民労働者が話さない主要言語で、または(iii)国家当局は、現代奴隷制に関するモジュールに同意しないか、同意する可能性は低い。調査が実施されなかった西ヨーロッパのいくつかの国とは異なり、これらの小地域のどの国も、調査が実施された48か国の回答者によって搾取の場所として特定されませんでした。
4/ Final calculation of estimated prevalence, including state-imposed forced labourThe process outlined in steps 1 to 3 produces prevalence estimates for all forms of modern slavery except state-imposed forced labour. Given the nationally-specific manifestations of state-imposed forced labour where it does occur, it was excluded from the steps outlined above. The final step involves aggregating the estimate resulting from the process set out above, with the estimates of state-imposed forced labour. A final estimate of the prevalence of all forms of modern slavery is then calculated. The resulting estimates are presented in Table 4.
Substantial gaps in data exist for the Arab States region and Gulf countries in particular. These gaps point to a significant underestimate of the extent of modern slavery in this region. As a result, the country-level estimates presented here are considered very conservative and should be interpreted cautiously. **Substantial gaps in data exist for the Central and East Asia subregions where, with the exception of Mongolia, surveys cannot be conducted for reasons such as (i) survey is only delivered face-to-face, (ii) survey is delivered only in the main language which many migrant workers do not speak, or (iii) national authorities would not, or were unlikely to, consent to the module on modern slavery. Unlike several countries in Western Europe where no surveys were conducted, none of the countries in these subregions were identified as sites of exploitation by respondents in the 48 countries where surveys were implement
データーベース元➡︎ https://www.globalslaveryindex.org/2018/findings/highlights/

この記事が気に入ったらサポートをしてみませんか?