なんか置いておくところ

こちらは自分が検証用に作った簡素なTradingView用インジケーターをソースコード付きで置いておくところになります。
導入サポートとかは特にありません。
DMとかいただいても対応いたしかねますのでご了承ください。
Crypto Market Cap(2023/11/29)
仮想通貨の時価総額を表示するインジケーター。
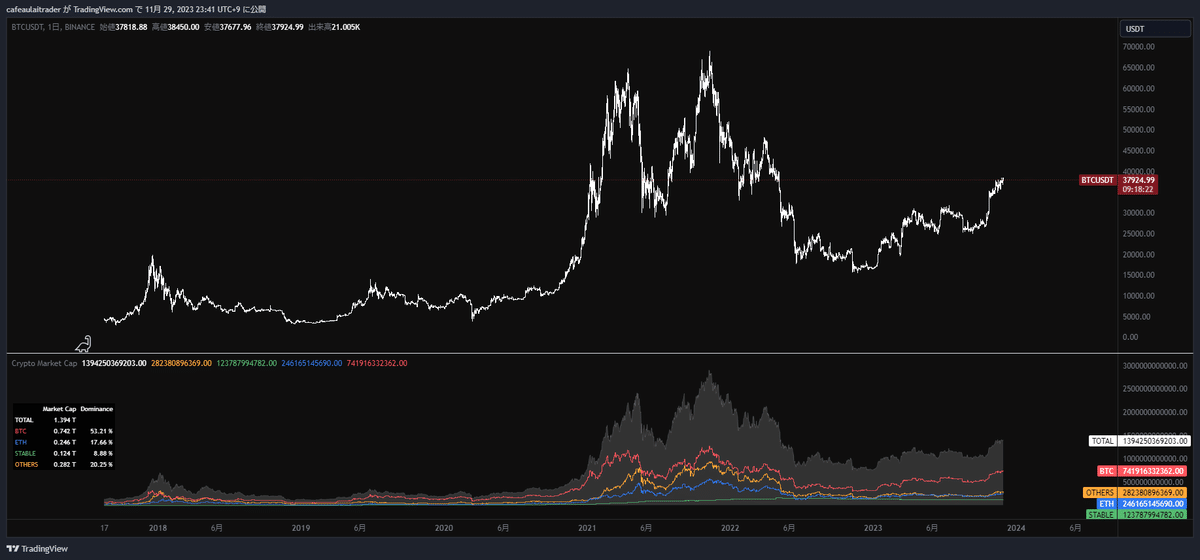
仮想通貨市場全体にどの程度の資金が入ってきているのかを日足レベルでザックリ把握したくて作りました。
前回バブルと比べて現在の時価総額がどの位置にあるのか、流入が停滞していないか等を見ていくつもりです。
Pine Script
//@version=5
indicator("Crypto Market Cap", overlay=false)

// ========== Settings ========== //
i_btc_color = input.color(#ff555e, "BTC", group="Color Settings")
i_eth_color = input.color(#2e79f0, "ETH", group="Color Settings")
i_stable_color = input.color(#56ba71, "STABLE", group="Color Settings")
i_others_color = input.color(#ffa838, "OTHERS", group="Color Settings")
i_total_color = input.color(#ffffff, "TOTAL", group="Color Settings")

i_switch_table = input.bool(true, title="Table ON/OFF", group="Table Settings")
i_table_text_size = input.string(defval="small", title="Text Size", options=["large", "normal", "small", "tiny"], group="Table Settings")
i_table_text_color = input.color(#ffffff, title="Table Text Color", group="Table Settings")
i_table_background_color = input.color(#000000dd, title="Table Background Color", group="Table Settings")


// ========== Functions ========== //
f_setTextSize(text_size) =>
	switch text_size
		"large" => size.large
		"normal" => size.normal
		"small" => size.small
		"tiny" => size.tiny


// ========== Data Call ========== //
total = request.security("CRYPTOCAP:TOTAL", timeframe.period, close)
btc = request.security("CRYPTOCAP:BTC", timeframe.period, close)
eth = request.security("CRYPTOCAP:ETH", timeframe.period, close)
usdt = request.security("CRYPTOCAP:USDT", timeframe.period, close)
usdc = request.security("CRYPTOCAP:USDC", timeframe.period, close)
dai = request.security("CRYPTOCAP:DAI", timeframe.period, close)
tusd = request.security("CRYPTOCAP:TUSD", timeframe.period, close)
busd = request.security("CRYPTOCAP:BUSD", timeframe.period, close)


// ========== Calculation & Plot ========== //
stable = nz(usdt) + nz(usdc) + nz(dai) + nz(tusd) + nz(busd)
others = total - (btc + eth + stable)
btcd = (btc / total) * 100
ethd = (eth / total) * 100
stabled = (stable / total) * 100
othersd = (others / total) * 100

plot(total, "TOTAL", color=color.new(i_total_color, 85), style=plot.style_area)
plot(others, "OTHERS", color=i_others_color, style=plot.style_stepline)
plot(stable, "STABLE", color=i_stable_color, style=plot.style_stepline)
plot(eth, "ETH", color=i_eth_color, style=plot.style_stepline)
plot(btc, "BTC", color=i_btc_color, style=plot.style_stepline)


// ========== Table ========== //
if i_switch_table
	table_text_size = f_setTextSize(i_table_text_size)
	var data_table = table.new(position=position.middle_left, rows=6, columns=3, bgcolor=i_table_background_color)
	table.cell(data_table, row=0, column=0, text="", text_color=i_table_text_color, text_halign=text.align_center, text_size=table_text_size)
	table.cell(data_table, row=0, column=1, text="Market Cap", text_color=i_table_text_color, text_halign=text.align_center, text_size=table_text_size)
	table.cell(data_table, row=0, column=2, text="Dominance", text_color=i_table_text_color, text_halign=text.align_center, text_size=table_text_size)
	table.cell(data_table, row=1, column=0, text="TOTAL", text_color=i_total_color, text_halign=text.align_left, text_size=table_text_size)
	table.cell(data_table, row=1, column=1, text=str.tostring(math.round(total / 1000000000000, 3)) + " T", text_color=i_table_text_color, text_halign=text.align_right, text_size=table_text_size)
	table.cell(data_table, row=1, column=2, text="", text_color=i_table_text_color, text_halign=text.align_right, text_size=table_text_size)
	table.cell(data_table, row=2, column=0, text="BTC", text_color=i_btc_color, text_halign=text.align_left, text_size=table_text_size)
	table.cell(data_table, row=2, column=1, text=str.tostring(math.round(btc / 1000000000000, 3)) + " T", text_color=i_table_text_color, text_halign=text.align_right, text_size=table_text_size)
	table.cell(data_table, row=2, column=2, text=str.tostring(math.round(btcd, 2)) + " %", text_color=i_table_text_color, text_halign=text.align_right, text_size=table_text_size)
	table.cell(data_table, row=3, column=0, text="ETH", text_color=i_eth_color, text_halign=text.align_left, text_size=table_text_size)
	table.cell(data_table, row=3, column=1, text=str.tostring(math.round(eth / 1000000000000, 3)) + " T", text_color=i_table_text_color, text_halign=text.align_right, text_size=table_text_size)
	table.cell(data_table, row=3, column=2, text=str.tostring(math.round(ethd, 2)) + " %", text_color=i_table_text_color, text_halign=text.align_right, text_size=table_text_size)
	table.cell(data_table, row=4, column=0, text="STABLE", text_color=i_stable_color, text_halign=text.align_left, text_size=table_text_size)
	table.cell(data_table, row=4, column=1, text=str.tostring(math.round(stable / 1000000000000, 3)) + " T", text_color=i_table_text_color, text_halign=text.align_right, text_size=table_text_size)
	table.cell(data_table, row=4, column=2, text=str.tostring(math.round(stabled, 2)) + " %", text_color=i_table_text_color, text_halign=text.align_right, text_size=table_text_size)
	table.cell(data_table, row=5, column=0, text="OTHERS", text_color=i_others_color, text_halign=text.align_left, text_size=table_text_size)
	table.cell(data_table, row=5, column=1, text=str.tostring(math.round(others / 1000000000000, 3)) + " T", text_color=i_table_text_color, text_halign=text.align_right, text_size=table_text_size)
	table.cell(data_table, row=5, column=2, text=str.tostring(math.round(othersd, 2)) + " %", text_color=i_table_text_color, text_halign=text.align_right, text_size=table_text_size)
CME Futures OI(2023/11/19)
CMEのBTC先物またはETH先物のOIを表示するインジケーター。

日足以上ならCME先物のOI取得できるじゃん!ってことで作ってみたもの。
今のところ使い道がよく分からないので誰か教えてください。
設定値

コインと年月を選んで表示するだけです。
Pine Script
//@version=5
indicator("CME Futures OI", overlay=false)

// ========== Settings ========== //
i_coin = input.string("BTC", "Coin", options=["BTC", "ETH"], group="Symbol Settings")

i_c1_switch = input.bool(true, title="", inline="cme1", group="Symbol Settings")
i_c2_switch = input.bool(true, title="", inline="cme2", group="Symbol Settings")
i_c3_switch = input.bool(true, title="", inline="cme3", group="Symbol Settings")
i_c4_switch = input.bool(true, title="", inline="cme4", group="Symbol Settings")
i_c5_switch = input.bool(true, title="", inline="cme5", group="Symbol Settings")

i_c1_year = input.string("2023", "CME1", options=["2023", "2024"], inline="cme1", group="Symbol Settings")
i_c1_month = input.string("11月", "年", options=["1月", "2月", "3月", "4月", "5月", "6月", "7月", "8月", "9月", "10月", "11月", "12月"], inline="cme1", group="Symbol Settings")
i_c2_year = input.string("2023", "CME2", options=["2023", "2024"], inline="cme2", group="Symbol Settings")
i_c2_month = input.string("12月", "年", options=["1月", "2月", "3月", "4月", "5月", "6月", "7月", "8月", "9月", "10月", "11月", "12月"], inline="cme2", group="Symbol Settings")
i_c3_year = input.string("2024", "CME3", options=["2023", "2024"], inline="cme3", group="Symbol Settings")
i_c3_month = input.string("1月", "年", options=["1月", "2月", "3月", "4月", "5月", "6月", "7月", "8月", "9月", "10月", "11月", "12月"], inline="cme3", group="Symbol Settings")
i_c4_year = input.string("2024", "CME4", options=["2023", "2024"], inline="cme4", group="Symbol Settings")
i_c4_month = input.string("2月", "年", options=["1月", "2月", "3月", "4月", "5月", "6月", "7月", "8月", "9月", "10月", "11月", "12月"], inline="cme4", group="Symbol Settings")
i_c5_year = input.string("2024", "CME5", options=["2023", "2024"], inline="cme5", group="Symbol Settings")
i_c5_month = input.string("3月", "年", options=["1月", "2月", "3月", "4月", "5月", "6月", "7月", "8月", "9月", "10月", "11月", "12月"], inline="cme5", group="Symbol Settings")

i_c1_color = input.color(#ffb74d, "", inline="cme1", group="Symbol Settings")
i_c2_color = input.color(#9575cd, "", inline="cme2", group="Symbol Settings")
i_c3_color = input.color(#f06292, "", inline="cme3", group="Symbol Settings")
i_c4_color = input.color(#5b9cf6, "", inline="cme4", group="Symbol Settings")
i_c5_color = input.color(#4caf50, "", inline="cme5", group="Symbol Settings")

i_labelShift = input.int(defval=5, title="Label Shift", minval=1, step=1)


// ========== Functions ========== //
f_getContractCode(_month) =>
	switch _month
		"1月" => "F"
		"2月" => "G"
		"3月" => "H"
		"4月" => "J"
		"5月" => "K"
		"6月" => "M"
		"7月" => "N"
		"8月" => "Q"
		"9月" => "U"
		"10月" => "V"
		"11月" => "X"
		"12月" => "Z"
		=> na


// ========== Data Call ========== //
c1_tickerid = "CME:" + i_coin + f_getContractCode(i_c1_month) + i_c1_year + "_OI"
c2_tickerid = "CME:" + i_coin + f_getContractCode(i_c2_month) + i_c2_year + "_OI"
c3_tickerid = "CME:" + i_coin + f_getContractCode(i_c3_month) + i_c3_year + "_OI"
c4_tickerid = "CME:" + i_coin + f_getContractCode(i_c4_month) + i_c4_year + "_OI"
c5_tickerid = "CME:" + i_coin + f_getContractCode(i_c5_month) + i_c5_year + "_OI"
c1_oi = i_c1_switch ? request.security(c1_tickerid, timeframe.period, close, ignore_invalid_symbol=true) : na
c2_oi = i_c2_switch ? request.security(c2_tickerid, timeframe.period, close, ignore_invalid_symbol=true) : na
c3_oi = i_c3_switch ? request.security(c3_tickerid, timeframe.period, close, ignore_invalid_symbol=true) : na
c4_oi = i_c4_switch ? request.security(c4_tickerid, timeframe.period, close, ignore_invalid_symbol=true) : na
c5_oi = i_c5_switch ? request.security(c5_tickerid, timeframe.period, close, ignore_invalid_symbol=true) : na
var l1 = i_c1_switch ? label.new(bar_index, na, text="_ " + i_coin + i_c1_year + "年" + i_c1_month + "限OI", textcolor=i_c1_color, color=#ffffff00, style=label.style_label_left, xloc=xloc.bar_index, size=size.small, textalign=text.align_left) : na
var l2 = i_c2_switch ? label.new(bar_index, na, text="_ " + i_coin + i_c2_year + "年" + i_c2_month + "限OI", textcolor=i_c2_color, color=#ffffff00, style=label.style_label_left, xloc=xloc.bar_index, size=size.small, textalign=text.align_left) : na
var l3 = i_c3_switch ? label.new(bar_index, na, text="_ " + i_coin + i_c3_year + "年" + i_c3_month + "限OI", textcolor=i_c3_color, color=#ffffff00, style=label.style_label_left, xloc=xloc.bar_index, size=size.small, textalign=text.align_left) : na
var l4 = i_c4_switch ? label.new(bar_index, na, text="_ " + i_coin + i_c4_year + "年" + i_c4_month + "限OI", textcolor=i_c4_color, color=#ffffff00, style=label.style_label_left, xloc=xloc.bar_index, size=size.small, textalign=text.align_left) : na
var l5 = i_c5_switch ? label.new(bar_index, na, text="_ " + i_coin + i_c5_year + "年" + i_c5_month + "限OI", textcolor=i_c5_color, color=#ffffff00, style=label.style_label_left, xloc=xloc.bar_index, size=size.small, textalign=text.align_left) : na


// ========== Calculation & Plot ========== //
plot(c1_oi, color=i_c1_color, style=plot.style_stepline)
plot(c2_oi, color=i_c2_color, style=plot.style_stepline)
plot(c3_oi, color=i_c3_color, style=plot.style_stepline)
plot(c4_oi, color=i_c4_color, style=plot.style_stepline)
plot(c5_oi, color=i_c5_color, style=plot.style_stepline)
plot(nz(c5_oi) + nz(c4_oi) + nz(c3_oi) + nz(c2_oi) + nz(c1_oi), color=#ffffff20, style=plot.style_area)
label.set_xy(l1, bar_index + i_labelShift, c1_oi)
label.set_xy(l2, bar_index + i_labelShift, c2_oi)
label.set_xy(l3, bar_index + i_labelShift, c3_oi)
label.set_xy(l4, bar_index + i_labelShift, c4_oi)
label.set_xy(l5, bar_index + i_labelShift, c5_oi)
Volume Delta Candle(2023/08/01)
疑似的な買いの出来高と売りの出来高のデルタとデルタ最大値・最小値を可視化したインジケーター。

疑似的というのは、1分足が陽線なら当該足の出来高を買いの出来高として扱い、1分足が陰線なら売りの出来高として扱っているためです。
TradingViewでは買いと売りの出来高を区別できないことによる苦肉の策です。
ExochartsのDBarsにあるDeltaMaxとDeltaMinの概念をTradingView上でも再現して、Exochartsで遡れない過去からのバックテストをやってみたかったわけですが、似たようなものはできても、やはり正確なデータに迫るのは難しいなあといった感じになりました。

疑似とはいえ出来高が一方向に傾いているのか、拮抗し始めてるのかはそれとなく見える化できてると思うので、ここに置いておきます。
正確なデータを見たい場合はExochartsを見て下さいということで。
設定値

デフォルトではチャート上に表示されている取引所の通貨の出来高をもとにVolume Delta Candleを計算します。

取引所と通貨建てを選んでやると、指定した取引所の通貨でVolume Delta Candleを計算します。
対応する通貨ペアが存在しない場合にはエラーとなります。
Pine Script
//@version=5
indicator("Volume Delta Candle", overlay=false)

// ========== Settings ========== //
i_exchange = input.string("", "Exchange", options=["", "Binance Spot", "Binance Perp", "Okx Perp", "Bybit Perp", "Coinbase", "Upbit"])
i_unit = input.string("", "Currency", options=["", "USDT", "USD", "KRW"])

i_color = input.color(#9598a1, title="Default", group="Color Settings")
i_color_plus = input.color(#4caf50, title="Delta +", group="Color Settings")
i_color_minus = input.color(#f23645, title="Delta -", group="Color Settings")
i_tableTextColor = input.color(#ffffff40, title="Table Text Color", group="Color Settings")


// ========== Function ========== //
f_createTickerid(_basecurrency, _exchange, _unit) =>
	switch _exchange
		"Binance Spot" => "BINANCE:" + _basecurrency + _unit
		"Binance Perp" => "BINANCE:" + _basecurrency + _unit + ".P"
		"Okx Perp" => "OKX:" + _basecurrency + _unit + ".P"
		"Bybit Perp" => "BYBIT:" + _basecurrency + _unit + ".P"
		"Coinbase" => "COINBASE:" + _basecurrency + _unit
		"Upbit" => "UPBIT:" + _basecurrency + _unit
		=> _basecurrency

f_volumeDelta(_change_array, _volume_array) =>
	float delta = 0
	float delta_max = 0
	float delta_min = 0

	if array.size(_change_array) > 0
		for [index, _change] in _change_array
			// 陽線か陰線かで出来高を分類
			if _change > 0
				delta += array.get(_volume_array, index)
			else if _change < 0
				delta -= array.get(_volume_array, index)
			// DeltaのMaxとMinを更新
			if delta > delta_max
				delta_max := delta
			else if delta < delta_min
				delta_min := delta
	[delta, delta_max, delta_min]


// ========== Data Call ========== //
basecurrency = i_exchange == "" ? syminfo.tickerid : syminfo.basecurrency
tickerid = f_createTickerid(basecurrency, i_exchange, i_unit)
[ltf_change_array, ltf_volume_array] = request.security_lower_tf(tickerid, "1", [close - open, volume])


// ========== Calculation & Plot ========== //
[delta, delta_max, delta_min] = f_volumeDelta(ltf_change_array, ltf_volume_array)

color candle_color = delta > 0 ? i_color_plus : delta < 0 ? i_color_minus : i_color
plotcandle(0, delta_max, delta_min, delta, color=candle_color, wickcolor=candle_color, bordercolor=candle_color, editable=false)


// ========== Table ========== //
var labelTable = table.new(position=position.middle_center, rows=1, columns=1)
table.cell(labelTable, row=0, column=0, text=str.tostring(tickerid), text_color=i_tableTextColor, text_halign=text.align_left, text_size=size.large)
Volume Score(2023/05/06)
出来高のZ-scoreを計算し、異常な出来高のあったポイントを可視化するインジケーター。

検証目的ではなく実戦用に作成しましたので、ここに置いてある他のやつよりは改造して使いやすいんじゃないかと思います。
設定値

Timeframeは計算対象となる下位足の時間です。1分足から5分足まで選べます。
長期足で使用する場合は、1分足より3分足とか5分足の方が都合がいいんじゃないかと思います。
期間はZ-scoreを計算する対象となる期間です。
デフォルト設定では「1分足」の期間「1440」なので、直近24時間分を計算対象にしています。
閾値は5段階でフィルタリングしています。
他の自作インジではラベルの大きさを変えたりしていますが、このインジケーターでは実験的に色の透明度で強弱を表現しています。ラベルの大小もコメントアウトをなくせば変えられます。
色も一応陽線と陰線で分けていますが、他のインジケーターと併用した際の視認性の問題から陽線は三角、陰線は逆三角で表現しています。
アラート機能も付けてあります。
あんまり低い数値にすると鳴りまくるので適切に設定してみてください。

あとはラベルにカーソルを持っていくとZ-scoreと出来高の数値を確認することができます。
これを見ながら閾値やアラートを調整するとイイ感じになるんじゃないでしょうか。
Pine Script
//@version=5
indicator("Volume Score", overlay=true, max_labels_count=300)

// ========== Settings ========== //
// 計算に利用する下位足の設定
i_timeframe = input.string("1", "timeframe", options=["1", "2", "3", "4", "5"])
i_length = input.int(1440, "length", minval=1, step=1, tooltip="timeframeで設定した分足ベースのZ-score計算期間")

// 閾値の設定
i_switch_1 = input.bool(true, title="", group="Threshold Settings", inline="threshold1")
i_switch_2 = input.bool(true, title="", group="Threshold Settings", inline="threshold2")
i_switch_3 = input.bool(true, title="", group="Threshold Settings", inline="threshold3")
i_switch_4 = input.bool(true, title="", group="Threshold Settings", inline="threshold4")
i_switch_5 = input.bool(true, title="", group="Threshold Settings", inline="threshold5")
i_zscore_threshold_1 = input.float(5.0, "Z-score threshold 1", minval=1.0, step=0.1, group="Threshold Settings", inline="threshold1", tooltip="閾値ごとに色の透明度を変える")
i_zscore_threshold_2 = input.float(10.0, "Z-score threshold 2", minval=2.0, step=0.1, group="Threshold Settings", inline="threshold2")
i_zscore_threshold_3 = input.float(15.0, "Z-score threshold 3", minval=3.0, step=0.1, group="Threshold Settings", inline="threshold3")
i_zscore_threshold_4 = input.float(20.0, "Z-score threshold 4", minval=4.0, step=0.1, group="Threshold Settings", inline="threshold4")
i_zscore_threshold_5 = input.float(25.0, "Z-score threshold 5", minval=5.0, step=0.1, group="Threshold Settings", inline="threshold5")

// 色の設定
i_color = input.color(#9598a1, title="Default", group="Color Settings")
i_color_plus = input.color(#f57f17, title="Price +", group="Color Settings")
i_color_minus = input.color(#f57f17, title="Price -", group="Color Settings")

// アラートの設定
i_volume_alert = input.float(10.0, "Volume Z-score Alert", minval=0.01, step=0.01, group="Alert Settings")


// ========== Data Call ========== //
// シンボルを取得
tickerid = syminfo.tickerid
// シンボルの下位足データを呼び出し
[ltf_close_array, ltf_change_array, ltf_volume_array] = request.security_lower_tf(tickerid, i_timeframe, [close, close - open, volume])
ltf_volume = request.security(tickerid, i_timeframe, volume)


// ========== Calculation & Plot ========== //
// 設定した下位足の出来高SMAと標準偏差を計算
float ltf_volume_sma = ta.sma(ltf_volume, i_length)
float ltf_volume_stdev = ta.stdev(ltf_volume, i_length)

bool isVolumeAlert = false
if array.size(ltf_volume_array) > 0
	for [index, _volume] in ltf_volume_array
		// Z-scoreを計算
		float z_score = (_volume - ltf_volume_sma) / ltf_volume_stdev

		// Z-scoreが閾値以上の場合はラベルを描画する
        if z_score >= i_zscore_threshold_1

			// 下位足が陽線の場合と陰線の場合で描画するラベルと色を変更する
			float price_change = array.get(ltf_change_array, index)
			label_style = price_change >= 0.0 ? label.style_triangleup : label.style_triangledown
			label_color = price_change >= 0.0 ? i_color_plus : i_color_minus

			// 下位足終値の位置にラベルを描画するため価格を取得
			float price = array.get(ltf_close_array, index)

			label_size = size.tiny
			// 閾値ごとに色の透明度(またはサイズ)を設定していく
			if z_score >= i_zscore_threshold_5
				// 閾値ごとにON/OFFを切り替えられるようにする
				price := i_switch_5 ? price : na
				label_color := color.new(label_color, 0)
				//label_size := size.huge
			else if z_score >= i_zscore_threshold_4
				price := i_switch_4 ? price : na
				label_color := color.new(label_color, 20)
				//label_size := size.large
			else if z_score >= i_zscore_threshold_3
				price := i_switch_3 ? price : na
				label_color := color.new(label_color, 40)
				//label_size := size.normal
			else if z_score >= i_zscore_threshold_2
				price := i_switch_2 ? price : na
				label_color := color.new(label_color, 60)
				//label_size := size.small
			else
				price := i_switch_1 ? price : na
				label_color := color.new(label_color, 80)
				//label_size := size.tiny
			// ラベルの描画
			label.new(bar_index, price, text="", color=label_color, style=label_style, size=label_size, tooltip="Z-score: " + str.tostring(math.round(z_score, 2)) + "\n" + "Volume: " + str.tostring(_volume))

		// アラート条件の確認
		if z_score >= i_volume_alert
			isVolumeAlert := true


// ========== Alert ========== //
alertcondition(isVolumeAlert, "Volume Z-score Alert", "Volume Z-score Alert - {{exchange}}:{{ticker}}@{{close}}")
Crypto Dominance(2022/12/30)
仮想通貨のドミナンス(仮想通貨全体の時価総額に占める個々のコインの時価総額の割合)を累積表示させただけのもの。
どんな表示になるか見てみたかったのと作業の合間の現実逃避に作りました。

Pine Script
//@version=5
indicator("Crypto Dominance", overlay=false)

// 相関係数の表示・非表示のチェックボックス
i_switch1 = input.bool(true, title="", inline="s1")
i_switch2 = input.bool(true, title="", inline="s2")
i_switch3 = input.bool(true, title="", inline="s3")
i_switch4 = input.bool(true, title="", inline="s4")
i_switch5 = input.bool(true, title="", inline="s5")
i_switch6 = input.bool(true, title="", inline="s6")
i_switch7 = input.bool(true, title="", inline="s7")
i_switch8 = input.bool(true, title="", inline="s8")
i_switch9 = input.bool(true, title="", inline="s9")
i_switch10 = input.bool(true, title="", inline="s10")

// 相関係数を計算する対象のシンボル
i_sym1 = input.symbol("CRYPTOCAP:BTC.D", "", inline="s1")
i_sym2 = input.symbol("CRYPTOCAP:ETH.D", "", inline="s2")
i_sym3 = input.symbol("CRYPTOCAP:USDT.D", "", inline="s3")
i_sym4 = input.symbol("CRYPTOCAP:USDC.D", "", inline="s4")
i_sym5 = input.symbol("CRYPTOCAP:BNB.D", "", inline="s5")
i_sym6 = input.symbol("CRYPTOCAP:XRP.D", "", inline="s6")
i_sym7 = input.symbol("CRYPTOCAP:DOGE.D", "", inline="s7")
i_sym8 = input.symbol("CRYPTOCAP:ADA.D", "", inline="s8")
i_sym9 = input.symbol("CRYPTOCAP:MATIC.D", "", inline="s9")
i_sym10 = input.symbol("CRYPTOCAP:OTHERS.D", "", inline="s10")

// 色の設定
i_color1 = input.color(#f23645, title="", inline="s1")
i_color2 = input.color(#ff9800, title="", inline="s2")
i_color3 = input.color(#2962ff, title="", inline="s3")
i_color4 = input.color(#673ab7, title="", inline="s4")
i_color5 = input.color(#4caf50, title="", inline="s5")
i_color6 = input.color(#00bcd4, title="", inline="s6")
i_color7 = input.color(#9598a1, title="", inline="s7")
i_color8 = input.color(#880e4f, title="", inline="s8")
i_color9 = input.color(#006064, title="", inline="s9")
i_color10 = input.color(#5b9cf6, title="", inline="s10")

// テーブルの設定
i_tableTextColor = input.color(#FFFFFF, title="テーブルテキスト色")
i_tableBackgroundColor = input.color(#000000CC, title="テーブル背景色")


// 設定したシンボルの呼び出し
sym1 = i_switch1 ? request.security(i_sym1, timeframe.period, close) : 0
sym2 = i_switch2 ? request.security(i_sym2, timeframe.period, close) : 0
sym3 = i_switch3 ? request.security(i_sym3, timeframe.period, close) : 0
sym4 = i_switch4 ? request.security(i_sym4, timeframe.period, close) : 0
sym5 = i_switch5 ? request.security(i_sym5, timeframe.period, close) : 0
sym6 = i_switch6 ? request.security(i_sym6, timeframe.period, close) : 0
sym7 = i_switch7 ? request.security(i_sym7, timeframe.period, close) : 0
sym8 = i_switch8 ? request.security(i_sym8, timeframe.period, close) : 0
sym9 = i_switch9 ? request.security(i_sym9, timeframe.period, close) : 0
sym10 = i_switch10 ? request.security(i_sym10, timeframe.period, close) : 0


// グラフの描画
plot(sym1 + sym2 + sym3 + sym4 + sym5 + sym6 + sym7 + sym8 + sym9 + sym10, color=i_color10, style=plot.style_columns)
plot(sym1 + sym2 + sym3 + sym4 + sym5 + sym6 + sym7 + sym8 + sym9, color=i_color9, style=plot.style_columns)
plot(sym1 + sym2 + sym3 + sym4 + sym5 + sym6 + sym7 + sym8, color=i_color8, style=plot.style_columns)
plot(sym1 + sym2 + sym3 + sym4 + sym5 + sym6 + sym7, color=i_color7, style=plot.style_columns)
plot(sym1 + sym2 + sym3 + sym4 + sym5 + sym6, color=i_color6, style=plot.style_columns)
plot(sym1 + sym2 + sym3 + sym4 + sym5, color=i_color5, style=plot.style_columns)
plot(sym1 + sym2 + sym3 + sym4, color=i_color4, style=plot.style_columns)
plot(sym1 + sym2 + sym3, color=i_color3, style=plot.style_columns)
plot(sym1 + sym2, color=i_color2, style=plot.style_columns)
plot(sym1, color=i_color1, style=plot.style_columns)


// テーブルの描画
var labelTable = table.new(position=position.middle_left, rows=11, columns=2, bgcolor=i_tableBackgroundColor)
table.cell(labelTable, row=0, column=0, text="シンボル", text_color=i_tableTextColor)
table.cell(labelTable, row=0, column=1, text="ドミナンス", text_color=i_tableTextColor)
if i_switch1
	table.cell(labelTable, row=1, column=0, text=i_sym1, text_color=i_color1, text_halign=text.align_left)
	table.cell(labelTable, row=1, column=1, text=str.tostring(math.round(sym1, 2)), text_color=i_color1, text_halign=text.align_right)
if i_switch2
	table.cell(labelTable, row=2, column=0, text=i_sym2, text_color=i_color2, text_halign=text.align_left)
	table.cell(labelTable, row=2, column=1, text=str.tostring(math.round(sym2, 2)), text_color=i_color2, text_halign=text.align_right)
if i_switch3
	table.cell(labelTable, row=3, column=0, text=i_sym3, text_color=i_color3, text_halign=text.align_left)
	table.cell(labelTable, row=3, column=1, text=str.tostring(math.round(sym3, 2)), text_color=i_color3, text_halign=text.align_right)
if i_switch4
	table.cell(labelTable, row=4, column=0, text=i_sym4, text_color=i_color4, text_halign=text.align_left)
	table.cell(labelTable, row=4, column=1, text=str.tostring(math.round(sym4, 2)), text_color=i_color4, text_halign=text.align_right)
if i_switch5
	table.cell(labelTable, row=5, column=0, text=i_sym5, text_color=i_color5, text_halign=text.align_left)
	table.cell(labelTable, row=5, column=1, text=str.tostring(math.round(sym5, 2)), text_color=i_color5, text_halign=text.align_right)
if i_switch6
	table.cell(labelTable, row=6, column=0, text=i_sym6, text_color=i_color6, text_halign=text.align_left)
	table.cell(labelTable, row=6, column=1, text=str.tostring(math.round(sym6, 2)), text_color=i_color6, text_halign=text.align_right)
if i_switch7
	table.cell(labelTable, row=7, column=0, text=i_sym7, text_color=i_color7, text_halign=text.align_left)
	table.cell(labelTable, row=7, column=1, text=str.tostring(math.round(sym7, 2)), text_color=i_color7, text_halign=text.align_right)
if i_switch8
	table.cell(labelTable, row=8, column=0, text=i_sym8, text_color=i_color8, text_halign=text.align_left)
	table.cell(labelTable, row=8, column=1, text=str.tostring(math.round(sym8, 2)), text_color=i_color8, text_halign=text.align_right)
if i_switch9
	table.cell(labelTable, row=9, column=0, text=i_sym9, text_color=i_color9, text_halign=text.align_left)
	table.cell(labelTable, row=9, column=1, text=str.tostring(math.round(sym9, 2)), text_color=i_color9, text_halign=text.align_right)
if i_switch10
	table.cell(labelTable, row=10, column=0, text=i_sym10, text_color=i_color10, text_halign=text.align_left)
	table.cell(labelTable, row=10, column=1, text=str.tostring(math.round(sym10, 2)), text_color=i_color10, text_halign=text.align_right)
Correlation Coefficient Divergence(2022/12/25)
チャートに表示されているシンボルに対する指定した2種類のシンボルの相関係数と相関係数同士の乖離を表示するインジケーター。

仮想通貨における相関トレードの足掛かりにならないかなあと思い、よく言及されるゴールドの相関関係をベースにお試しで作成しました。
指定したシンボル同士の相関係数が似ていることが前提で、それが乖離したあとの元に戻る動きを狙えるのか?という検証を目的としています。
設定値

期間は相関係数を算出するのに遡るデータ数。
シンボルの横にあるチェックを外すと相関係数が非表示になります。
閾値+以上と閾値-以下の時には指定した色で相関係数乖離グラフが色付けされます。
Pine Script
//@version=5
indicator("Correlation Coefficient Divergence", shorttitle="CCD", overlay=false)

// 相関係数の計算対象するソースと期間の設定
i_src = input.source(close, "Source")
i_len = input.int(30, title="Period")

// 相関係数の表示・非表示のチェックボックス
i_cc1Switch = input.bool(true, title="", inline="cc1")
i_cc2Switch = input.bool(true, title="", inline="cc2")
i_plSwitch = input.bool(false, title="", inline="pl")
i_mlSwitch = input.bool(false, title="", inline="ml")

// 相関係数を計算する対象のシンボル
i_sym1 = input.symbol("TVC:US10Y", "シンボル1", inline="cc1")
i_sym2 = input.symbol("TVC:DXY", "シンボル2", inline="cc2")

// 閾値の設定
i_plusLine = input.float(1.00, title="閾値+", minval=0.01, maxval=2.00, step=0.01, inline="pl")
i_minusLine = input.float(-1.00, title="閾値-", minval=-2.00, maxval=-0.01, step=0.01, inline="ml")

// 色の設定
i_ccDeltaColor = input.color(#434651, title="相関係数乖離")
i_cc1Color = input.color(#e65100, title="", inline="cc1")
i_cc2Color = input.color(#ffb74d, title="", inline="cc2")
i_ccPlusColor = input.color(#4caf50, title="", inline="pl")
i_ccMinusColor = input.color(#f23645, title="", inline="ml")
i_linePlusColor = input.color(#ffeb3b, title="", inline="pl")
i_lineMinusColor = input.color(#ffeb3b, title="", inline="ml")


// 設定したシンボルの呼び出し
sym1 = request.security(i_sym1, timeframe.period, i_src)
sym2 = request.security(i_sym2, timeframe.period, i_src)


// 相関係数の計算
cc1  =  ta.correlation(i_src, sym1, i_len)
cc2  =  ta.correlation(i_src, sym2, i_len)
ccDelta = cc1 - cc2

// グラフの描画
hline(i_plSwitch ? i_plusLine : na, color=i_linePlusColor, linestyle=hline.style_dotted)
hline(i_mlSwitch ? i_minusLine : na, color=i_lineMinusColor, linestyle=hline.style_dotted)
plot(ccDelta, color=ccDelta >= i_plusLine ? i_ccPlusColor : ccDelta <= i_minusLine ? i_ccMinusColor : i_ccDeltaColor, style=plot.style_area)
plot(i_cc1Switch ? cc1 : na, color=i_cc1Color, style=plot.style_line)
plot(i_cc2Switch ? cc2 : na, color=i_cc2Color, style=plot.style_line)
Futures Divergence(2022/12/18)
限月先物の期先と期近の乖離を見るためのインジケーター。
大口が期近から期先に乗り換えるときの値動きを検知できるのか?検知できるなら、それがマーケットの値動きに影響を及ぼす可能性はあるのか?といった点を検証しようと思い作りました。

設定値

先物取引所は「BINANCE」「BYBIT」「OKX」「DERIBIT」からの選択式です。
シンボルはソースコード内に直接書いてあります。
もう少し柔軟な形にしたかったのですが、PineScriptの配列の仕様が謎だったのに加えて途中で面倒くさくなって楽な方に流れました。
Pine Script
//@version=5
indicator("Futures Divergence", overlay=false)

// 期先物(期限があとのやつ)のシンボルを返す関数
f_secondNearbyFutures(exchange) =>
	switch exchange
		// H:3月限 M:6月限 U:9月限 Z:12月限
		"BINANCE" => "BINANCE:BTCH2023"
		"BYBIT" => "BYBIT:BTCUSDH2023"
		"OKX" => "OKX:BTCUSD31H2023"
		"DERIBIT" => "DERIBIT:BTCUSD31H2023"
		=> na

// 期近物(期限が先にくるやつ)のシンボルを返す関数
f_firstNearbyFutures(exchange) =>
	switch exchange
		"BINANCE" => "BINANCE:BTCZ2022"
		"BYBIT" => "BYBIT:BTCUSDZ2022"
		"OKX" => "OKX:BTCUSD30Z2022"
		"DERIBIT" => "DERIBIT:BTCUSD30Z2022"
		=> na


// 乖離値を計算する基準となる現物の設定
i_spot = input.symbol("COINBASE:BTCUSD", title="現物")

// 先物の乖離を比較する取引所の設定
i_exchange = input.string(defval="BINANCE", title="先物取引所", options=["BINANCE", "BYBIT", "OKX", "DERIBIT"])

// 表示・非表示のチェックボックス
i_secondNFSwitch = input.bool(true, title="【期先-現物】乖離", group="表示・非表示")
i_firstNFSwitch = input.bool(true, title="【期近-現物】乖離", group="表示・非表示")

// 色の設定
i_plusFDColor = input.color(#9598a180, title="【期先-期近】プラス乖離", group="色設定")
i_minusFDColor = input.color(#4866D180, title="【期先-期近】マイナス乖離", group="色設定")
i_secondNFColor = input.color(#e65100, title="【期先-現物】乖離", group="色設定")
i_firstNFColor = input.color(#ffb74d, title="【期近-現物】乖離", group="色設定")
i_tableTextColor = input.color(#FFFFFF, title="テーブルテキスト色", group="色設定")
i_tableBackgroundColor = input.color(#000000CC, title="テーブル背景色", group="色設定")


// 設定したシンボルのデータ呼び出し
spot = request.security(i_spot, timeframe.period, close)	// 現物
secondNF = request.security(f_secondNearbyFutures(i_exchange), timeframe.period, close)	// 期先物
firstNF = request.security(f_firstNearbyFutures(i_exchange), timeframe.period, close)	// 期近物


// 乖離値とSMAの計算
secondNFDivergence = secondNF - spot
firstNFDivergence = firstNF - spot
futuresDivergence = secondNF - firstNF


// グラフの描画
plot(futuresDivergence, title="【期先-期近】乖離", color=futuresDivergence >= 0 ? i_plusFDColor : i_minusFDColor, style=plot.style_area)
plot(i_secondNFSwitch ? secondNFDivergence : na, title="【期先-現物】乖離", color=i_secondNFColor)
plot(i_firstNFSwitch ? firstNFDivergence : na, title="【期近-現物】乖離", color=i_firstNFColor)


// テーブルの描画
var labelTable = table.new(position=position.bottom_left, rows=5, columns=2, bgcolor=i_tableBackgroundColor)
table.cell(labelTable, row=0, column=0, text="期先物", text_color=i_tableTextColor)
table.cell(labelTable, row=0, column=1, text=f_secondNearbyFutures(i_exchange), text_color=i_tableTextColor)
table.cell(labelTable, row=1, column=0, text="期近物", text_color=i_tableTextColor)
table.cell(labelTable, row=1, column=1, text=f_firstNearbyFutures(i_exchange), text_color=i_tableTextColor)
table.cell(labelTable, row=2, column=0, text="【期先-期近】", text_color=i_tableTextColor, text_halign=text.align_left)
table.cell(labelTable, row=2, column=1, text=str.tostring(futuresDivergence), text_color=i_tableTextColor, text_halign=text.align_right)
table.cell(labelTable, row=3, column=0, text="【期先-現物】", text_color=i_secondNFColor, text_halign=text.align_left)
table.cell(labelTable, row=3, column=1, text=str.tostring(secondNFDivergence), text_color=i_secondNFColor, text_halign=text.align_right)
table.cell(labelTable, row=4, column=0, text="【期近-現物】", text_color=i_firstNFColor, text_halign=text.align_left)
table.cell(labelTable, row=4, column=1, text=str.tostring(firstNFDivergence), text_color=i_firstNFColor, text_halign=text.align_right)
Spot Derivative Basis(2022/11/14)
現物と四半期先物の乖離を見るためのインジケーター。
ETHのThe Merge戦で役に立つかな~と思って作ってみたものの、視認性もイマイチで、特に役立つことなくお蔵入りとなりました。

デフォルトは乖離値表示ですが、設定で乖離率表示にも切り替えることができます。特に意味のない機能です。

設定値

デフォルトはコインベースのBTC現物にBinanceの無期限先物、残り4つは期限付き先物を放り込んであります。
Pine Script
 //@version=5
indicator("Spot Derivative Basis", overlay=false)

// 乖離値と乖離率の表示を切り替えられるようにする
i_display = input.string(defval="乖離値", title="表示形式", options=["乖離値", "乖離率"])

// 乖離値を計算する基準となる現物の設定
i_spot = input.symbol("COINBASE:BTCUSD", title="現物")

// 現物と比較する先物の設定
// 表示・非表示のチェックボックス
i_switch1 = input.bool(true, title="先物1", inline="D1")
i_switch2 = input.bool(true, title="先物2", inline="D2")
i_switch3 = input.bool(true, title="先物3", inline="D3")
i_switch4 = input.bool(true, title="先物4", inline="D4")
i_switch5 = input.bool(true, title="先物5", inline="D5")

// 色の設定
i_color1 = input.color(color.white, title="", inline="D1")
i_color2 = input.color(color.blue, title="", inline="D2")
i_color3 = input.color(color.green, title="", inline="D3")
i_color4 = input.color(color.yellow, title="", inline="D4")
i_color5 = input.color(color.purple, title="", inline="D5")

// 先物のシンボル設定
// H:3月限 M:6月限 U:9月限 Z:12月限
i_derivative1 = input.symbol("BINANCE:BTCUSDTPERP", title="", inline="D1")
i_derivative2 = input.symbol("BINANCE:BTCH2023", title="", inline="D2")
i_derivative3 = input.symbol("BYBIT:BTCUSDH2023", title="", inline="D3")
i_derivative4 = input.symbol("OKX:BTCUSD31H2023", title="", inline="D4")
i_derivative5 = input.symbol("DERIBIT:BTCUSD31H2023", title="", inline="D5")

// テーブルの設定
i_tableTextColor = input.color(#FFFFFF, title="テーブルテキスト色")
i_tableBackgroundColor = input.color(#000000CC, title="テーブル背景色")


// 設定したシンボルのデータ呼び出し
spot = request.security(i_spot, timeframe.period, close)
derivative1 = request.security(i_derivative1, timeframe.period, close)
derivative2 = request.security(i_derivative2, timeframe.period, close)
derivative3 = request.security(i_derivative3, timeframe.period, close)
derivative4 = request.security(i_derivative4, timeframe.period, close)
derivative5 = request.security(i_derivative5, timeframe.period, close)

// 乖離値or乖離率の計算
divergence1 = i_switch1 ? i_display == "乖離値" ? derivative1 - spot : math.round(((derivative1 - spot) / spot) * 100, 3) : na
divergence2 = i_switch2 ? i_display == "乖離値" ? derivative2 - spot : math.round(((derivative2 - spot) / spot) * 100, 3) : na
divergence3 = i_switch3 ? i_display == "乖離値" ? derivative3 - spot : math.round(((derivative3 - spot) / spot) * 100, 3) : na
divergence4 = i_switch4 ? i_display == "乖離値" ? derivative4 - spot : math.round(((derivative4 - spot) / spot) * 100, 3) : na
divergence5 = i_switch5 ? i_display == "乖離値" ? derivative5 - spot : math.round(((derivative5 - spot) / spot) * 100, 3) : na


// グラフの描画
plot(divergence1, title="Derivative1", color=i_color1)
plot(divergence2, title="Derivative2", color=i_color2)
plot(divergence3, title="Derivative3", color=i_color3)
plot(divergence4, title="Derivative4", color=i_color4)
plot(divergence5, title="Derivative5", color=i_color5)


// テーブルの描画
var labelTable = table.new(position=position.bottom_left, rows=6, columns=2, bgcolor=i_tableBackgroundColor)
table.cell(labelTable, row=0, column=0, text="シンボル", text_color=i_tableTextColor)
table.cell(labelTable, row=0, column=1, text=i_display, text_color=i_tableTextColor)
if i_switch1
	table.cell(labelTable, row=1, column=0, text=i_derivative1, text_color=i_color1, text_halign=text.align_left)
	table.cell(labelTable, row=1, column=1, text=str.tostring(divergence1), text_color=i_color1, text_halign=text.align_right)
if i_switch2
	table.cell(labelTable, row=2, column=0, text=i_derivative2, text_color=i_color2, text_halign=text.align_left)
	table.cell(labelTable, row=2, column=1, text=str.tostring(divergence2), text_color=i_color2, text_halign=text.align_right)
if i_switch3
	table.cell(labelTable, row=3, column=0, text=i_derivative3, text_color=i_color3, text_halign=text.align_left)
	table.cell(labelTable, row=3, column=1, text=str.tostring(divergence3), text_color=i_color3, text_halign=text.align_right)
if i_switch4
	table.cell(labelTable, row=4, column=0, text=i_derivative4, text_color=i_color4, text_halign=text.align_left)
	table.cell(labelTable, row=4, column=1, text=str.tostring(divergence4), text_color=i_color4, text_halign=text.align_right)
if i_switch5
	table.cell(labelTable, row=5, column=0, text=i_derivative5, text_color=i_color5, text_halign=text.align_left)
	table.cell(labelTable, row=5, column=1, text=str.tostring(divergence5), text_color=i_color5, text_halign=text.align_right)
Coinbase Premium Index(2022/11/10)
Coinbase Premium Indexに移動平均線と移動平均乖離を追加したインジケーター。

移動平均乖離を追加した理由は、2022年11月にUSDTのdepegが長期間続き、マイナスプレミアムが長く続いている最中でも変化点を見つけやすくしたかったからです。

設定値

デフォルトではSMAは非表示になっています。
移動平均乖離もチェックを外すことで、Coinbase Premium Indexのみを表示させることもできます。
Pine Script
//@version=5
indicator("Coinbase Premium Index", overlay=false)

// 比較するシンボルの設定
i_coin1 = input.symbol("COINBASE:BTCUSD", "Coin1")
i_coin2 = input.symbol("BINANCE:BTCUSDT", "Coin2")
i_src = input.source(close, "Source")

// 移動平均線からの乖離値を計算するためのSMAの設定
i_maSwitch = input.bool(false, title="SMA", inline="MA")
i_len = input.int(20, title="期間", inline="MA")
i_divergenceSwitch = input.bool(true, title="移動平均乖離を表示")

// 色の設定
i_indexPlusColor = input.color(#4866D180, title="Premium Index +")
i_indexMinusColor = input.color(#4866D180, title="Premium Index -")
i_divergencePlusColor = input.color(#FFFFFF, title="Divergence +")
i_divergenceMinusColor = input.color(#E2444C, title="Divergence -")
i_maColor = input.color(#FFEB3B, title="SMA")


// 設定したシンボルのデータ呼び出し
coin1 = request.security(i_coin1, timeframe.period, i_src)
coin2 = request.security(i_coin2, timeframe.period, i_src)

// Premium Indexと移動平均乖離値の計算
cpi = (coin1 - coin2) / coin1 * 100
ma = ta.sma(cpi, i_len)
divergence = cpi - ma


// グラフの描画
plot(cpi, title="Coinbase Premium Index", color=cpi >= 0 ? i_indexPlusColor : i_indexMinusColor, style=plot.style_area)
plot(i_divergenceSwitch ? divergence : na, title="Divergence", color=divergence >= 0 ? i_divergencePlusColor : i_divergenceMinusColor, style=plot.style_columns)
plot(i_maSwitch ? ma : na, title="SMA", color=i_maColor, style=plot.style_line)この記事が気に入ったらサポートをしてみませんか?