
AIが出題!統計学の仮説検定を実践で学ぶ

今回は前回の続きで、生成AIが作成した統計学の問題を解いていきます。
生成AIによる問題の概要
以下が、生成AIによって出題された問題です。
Ultimate Question: Automotive Engineering Statistical Analysis
You are an automotive engineer tasked with analyzing the performance and reliability of different steel types used in manufacturing car chassis. Your goal is to determine the most suitable steel type based on various statistical analyses.

Data Sources
You have collected data from the following sources:

Public Statistics: Industry standards and material databases such as MatWeb and ASM International.
Field Studies: Real-world data collected from car chassis tested under various conditions.
Data Collected
The data includes tensile strength, yield strength, and ductility for three types of steel (Steel A, Steel B, and Steel C). You also have frequency distributions for the number of defects found in cars using each steel type after one year of use.

Data Summary
Steel Type	Tensile Strength (MPa)	Yield Strength (MPa)	Ductility (%)	Number of Defects (per 100 cars)
Steel A	800	600	15	10
Steel B	1000 850 10	5
Steel C	600	400	20	15

Problem Statement
Data Distribution:

#1
Create a bar graph showing the tensile strength, yield strength, and ductility for each steel type.
Draw a histogram of the number of defects for each steel type.
Measures of Central Tendency:

#2
Calculate the mean, median, and mode for the tensile strength of the three steel types.
Determine the range, variance, and standard deviation for the yield strength of the steel types.
Scatterplot and Correlation:

#3
Create a scatterplot showing the relationship between tensile strength and ductility for the three steel types.
Calculate the correlation coefficient between tensile strength and ductility.
Regression Analysis:

#4
Perform a simple linear regression to predict the number of defects based on tensile strength. Provide the regression equation and interpret the slope.
Hypothesis Testing:

#5
Conduct a hypothesis test to determine if there is a significant difference in the mean number of defects between Steel A and Steel B. Use a 5% significance level and state the null and alternative hypotheses, test statistic, p-value, and conclusion.
Confidence Intervals:

#6
Calculate the 95% confidence interval for the mean tensile strength of Steel B.
Decision Making:

Based on your analyses, recommend the best steel type for manufacturing car chassis, considering both performance (tensile strength, yield strength, ductility) and reliability (number of defects).
前回までで問題4まで解きましたので、今回は問題5を解いていきます。鋼Aと鋼Bの欠陥数の平均が同じかどうかを仮説検定する問題です。
仮説検定の解き方
まず問題の理解から始めましょう。
| 鋼種 | 欠陥数 (100台当たり) |
| ---- | -------------------- |
| 鋼A | 10 |
| 鋼B | 5 |
この表を見ると、右の列の欠陥数に注目する必要があります。これは、100台あたりに何台欠陥があるかを示しています。つまり、100台をサンプリングしたときの標本平均を示しています。
次に、仮説検定の手順を確認します。仮説検定では、帰無仮説(H0)と対立仮説(H1)を決めます。
H0: 鋼Aの欠陥数の平均μ1 = 鋼Bの欠陥数の平均μ2
H1: 鋼Aの欠陥数の平均μ1 ≠ 鋼Bの欠陥数の平均μ2(有意水準α = 0.05)
母集団の分散がわからないため、標本の不偏分散を使用します。このため、正規分布ではなくt分布を使用して仮説検定を行います。
検定統計量tは次のように計算されます。
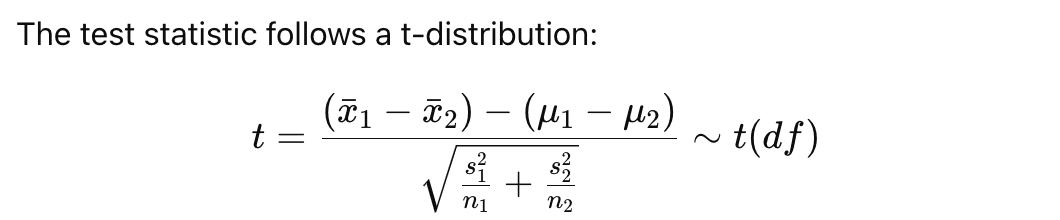
ここで、自由度は ( n1 + n2 - 2 ) です。計算結果をt分布表と比較し、帰無仮説を棄却するかどうかを判断します。
実際の計算を生成AIに依頼すると、t値は22.36となり、t(α/2 = 0.025) = 1.984と比較して非常に大きいことがわかりました。これにより、帰無仮説を棄却する結論に至りました。
今回は仮説検定の問題を解きましたが、やはり問題のイメージを図にしたほうがわかりやすいと感じました。
次回は問題のステップを図にしてiPadのノートアプリで書き、その画像を生成AIに読み込ませて訂正してもらうということを試みたいと思います。
引き続き、試行錯誤しながら学んでいきたいと思います!
この記事が気に入ったらサポートをしてみませんか?