
KDB and q documentation "Q for quants"の和訳②

↑元ネタ
↑前半
統計クエリ
Q is much used to aggregate across large datasets. For these examples, we will use simple aggregators (max, min, avg) and concentrate on doing complex things in the by-clause. One of the most powerful features of q is its ability to extend the query language with user-defined functions – so we can easily build custom aggregators.
"q"は大規模なデータセットの集計によく利用される。ここで紹介する例では、シンプルなアグリゲーター(max, min, avg)を使用し、by句で複雑なことを行うことに集中する。"q"の最もパワフルな特徴の一つは、ユーザ定義関数によってq言語の能力を拡張することができる点である。これによって、我々は簡単にカスタムアグリゲーターを作ることができる。
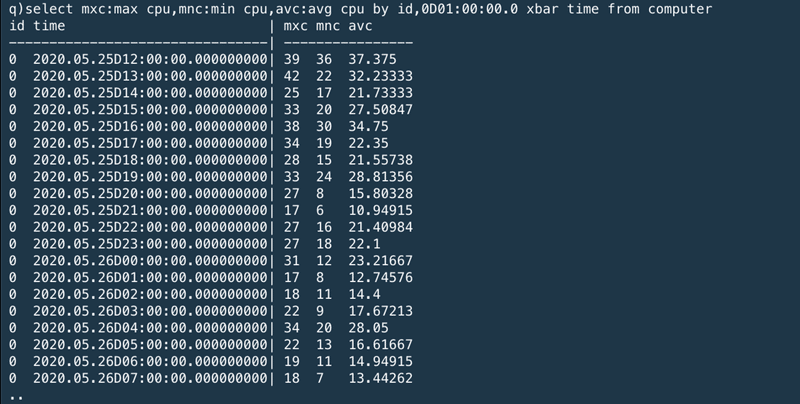
For the first example, we will calculate the maximum, minimum and average CPU usage for every machine, across the whole data set:
最初の例では、我々は前データセットからそれぞれのマシンの最大、最小、平均CPU利用率を算出する。
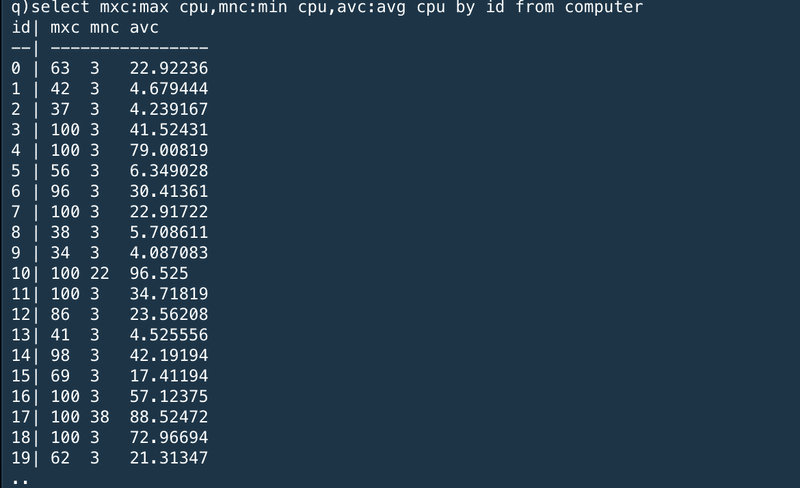
※表示名称:アグリゲーターでselectしてbyで括るっていう文法か
We can also do this for every date, by extracting the date component from the time field:
または、時間項目から日付要素を抽出することで日々のデータを得ることもできる。
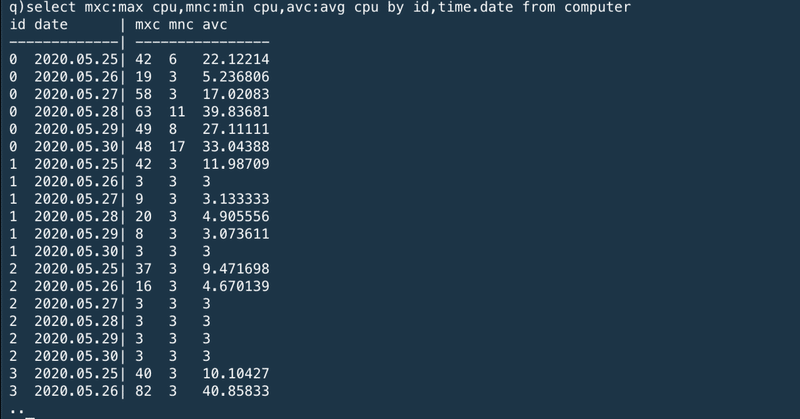
※byの中にtime.dataが追加された
Similarly, we can do this for the time portion. The code below will aggregate across hours in different days:
同じように、時間部分(タイムポーション、なんて訳すのが適当?)についても行うことができる。以下のコードは異なる日付の時間ごとに集計するものだ。
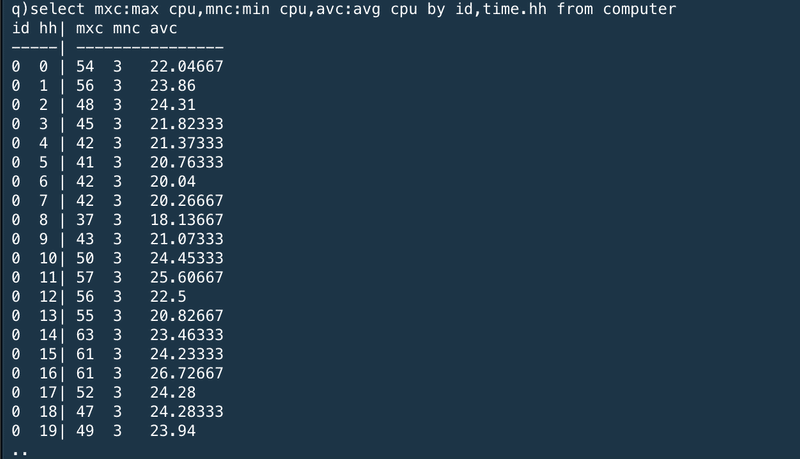
※by time.hhに変更している
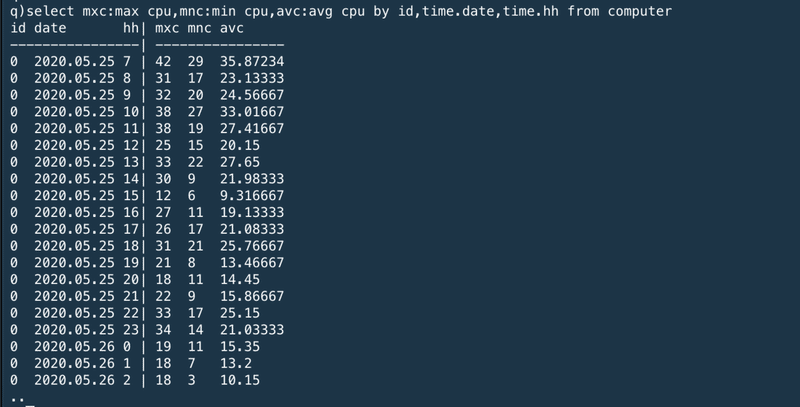
If that is not what is required, we can combine the aggregations to aggregate across each hour in each date separately:
それが必要ない場合は、集計を組み合わせて時間ごと、日付ごとに別々に集計できる。
Or alternatively we can use the xbar keyword to break the time list into buckets of any size. This is equivalent to the by id,time.date,time.hh query above, but is more efficient and has extra flexibility – the bucketing can be any size, all the way down to nanoseconds:
または代わりに"xbar"のキーワードを使って時間リストを任意のサイズに分割することができる。これは、上述した"by id, time.datem, time.hh"のクエリーと等価であるが、より効率的でより柔軟性がある。"xbar"を使うことで、ナノ秒まで任意のサイズで分割することができる。
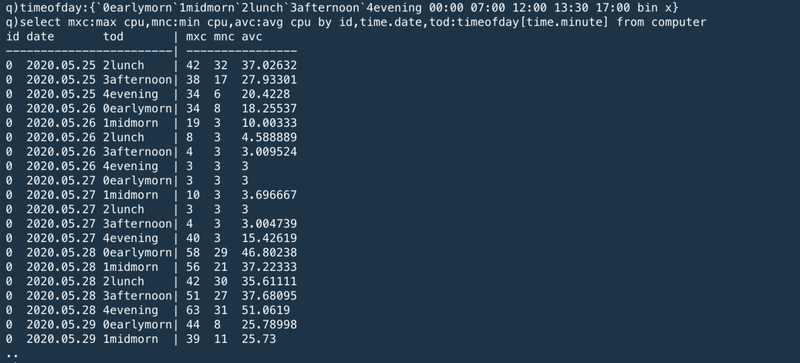
Another approach to breaking up the day might be to define a set of “daily periods”, e.g. early morning is from 00:00 to 07:00, midmorning is from 07:00 to 12:00, lunch is from 12:00 to 13:30, afternoon is from 13:30 to 17:00 and evening is after 17:00. We can aggregate the data according to these groupings by creating a function to map a minute value to a period of the day. This user-defined function drops in to the select statement in the same way as any built-in function.
1日を分割するもう一つのアプローチは、1日の区切りを定義することである。例えば、早朝(00:00~07:00)、朝(07:00~12:00)、正午(12:00~13:30)、昼(13:30~17:00)、夜(17:00~24:00)と区切る。1日の区切りをマッピングする関数を作ることでこれらのグルーピングを利用してデータを集計することができる。このようなユーザ定義関数はビルトイン関数を同様にselect文に利用することができる。
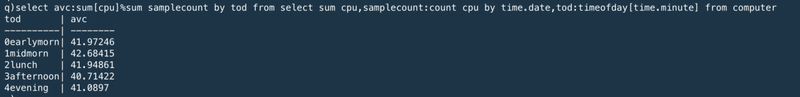
We can also generate an average usage profile in the date range for each time of day across all desktop machines. First, we aggregate the data and calculate the totals for each day in each time period. Then, we re-aggregate the data to get an average usage across all days.
同様に、すべてのデスクトップマシーンのそれぞれの時間区切りにおける平均利用率も生成することができる。まず、各日付・各時間区切りにおける合計値を算出する。そして、平均利用率を再集計する。
結合
Joins are very fast in q. Most q databases do not rely heavily on pre-defined foreign-key relationships between tables, as is common in standard RDMSs. Instead, ad-hoc joins are used. As an example, lj (left join) can be used join the computerlookup table to either the computer or calls table to show the static data on each computer id.
この記事が気に入ったらサポートをしてみませんか?