JVMのGCチューニングで、どこまで改善できるのか

またまた貴重な情報を放出しているExpediaグループが、今度はJVMのガベージコレクションのチューニングをフローチャートにまとめた。正直、苦手分野ではあるがエッセンスぐらいは吸収できるだろうか。
At the recent java2days conference, I presented my latest talk “Practical Garbage Collection Tuning For Anyone” which included a detailed decision chart for tuning your JVM’s garbage collection (GC).
Java2Days 2019での発表内容だ。Java2Daysのサイトのプロフィールを読むとHotels.comに勤務していてJavaPerformanceTuning.comというサイトを運営したりオライリーでもJavaの本を出している人らしい。発表資料そのものはJava2Daysになかった。(残念)
It’s only in the last couple of years that it has become possible to have a simple decision flow you can follow for JVM GC tuning. For most of the last decade GC tuning was arcane and fragile, but now the options are clearer and more targeted and there is a clear step-by-step procedure you can follow which I’ve detailed.
このように単純なフローになったのはここ1〜2年のことで、それまではひじょうに難解であった。
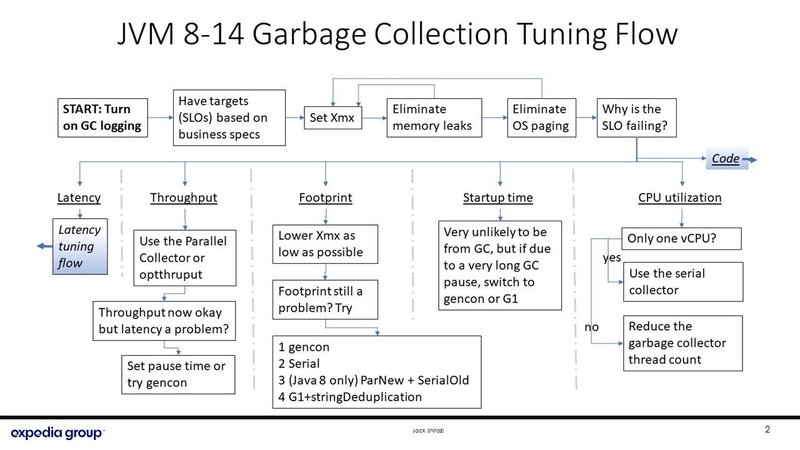
The flow shows which GC to choose depending on why your SLO is failing. Follow the flow to find which collector is right for your use case. For example, suppose you go through the steps of the top line of the first slide and find that in your tests or in production your GC latency is too high — a very common scenario.
このスライドではSLO(Service Level Objectiveのこと?)が悪い場合のワークフローを示している。
表の中のgenconとかXmx、Java8から増えたParNewといった、名前だけで何をするかわからないパラメータは、どういう場合に使うかわかるというわけだ。
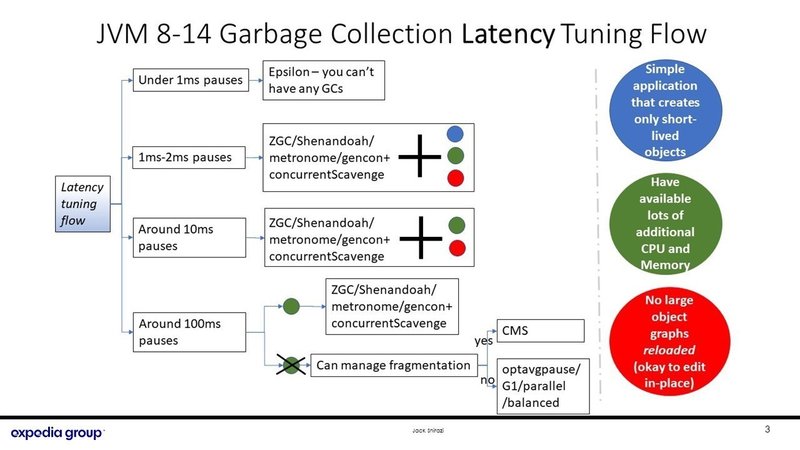
Suppose your targets are that pauses up to 100ms are acceptable, but you can’t really allocate much more CPU or memory (the path through the crossed out green circle). The good news is that the flow chart shows this is achievable without code tuning (bottom rows of the second slide). And it also shows you which collectors you can usefully try: five possible collectors, or four if your app is 24/7 with no interruptions (as in that case it will not be able to manage fragmentation).
2枚めのチャートでは、例えば100msの遅延が許容できてメモリを追加できない場合はフラグメントを管理できればCMSを、できなければoptavgpause/G1/parallel/balancedを使えばよいということがわかる。
まったく理解できてない状態でフローチャートを信じて使うのは危険だが、ある程度、自分で考え手を動かした人が自分の経験値を整理するような目的では、先人の智慧として役立ちそうだ。
この記事が気に入ったらサポートをしてみませんか?