
Strava/Withings Web API開発 - 開発編①(OpenWeather)

以下のリンクを参照して開発しました。
@Kazuya_Murakami氏がソースコードも公開してくれていて、殆どの箇所をほぼそのままの形で使わせて頂きました。感謝です。
(参考)Weather API(公式)
(参考)【Python】raspberry pi 置き時計に天気予報を追加した件
概要
コーディングの詳細は上記リンクやソースコードを見て頂くとして、要点を以下に整理します。
①メインウィンドウ/フレームを準備(Tkinter)
フレームは以下の3つのフレーム構成としました。
- 日付/地域表示フレーム(frame1)
- 天気予報(日次)表示フレーム(frame2)
- 天気予報(3時間毎)表示フレーム(frame3)
<イメージ図>

frame1は2行、frame2は4行(日付、天気、気温、降水量)×7列(月~日)、frame3は4行(時間、天気、気温、降水量)×8列(3時間毎×8項目)のレイアウトです。
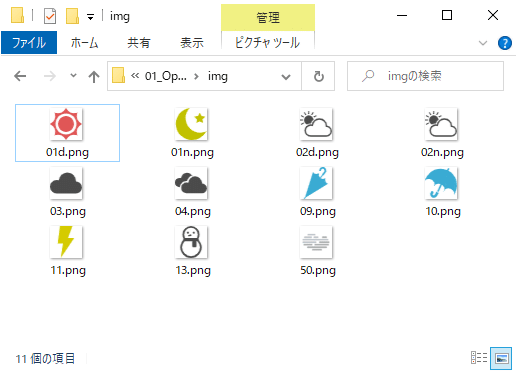
また、天気は以下の通りコード化されているので、それに応じたアイコンを準備する必要があります。
OpenWeatherMapの天気コード
<日中>
01d clear sky 快晴
02d few clouds 晴れ
03d scattered clouds くもり
04d broken clouds くもり
09d shower rain 小雨
10d rain 雨
11d thunderstorm 雷雨
13d snow 雪
50d mist 霧
<夜間>
01n clear sky 快晴
02n few clouds 晴れ
03n scattered clouds くもり
04n broken clouds くもり
09n shower rain 小雨
10n rain 雨
11n thunderstorm 雷雨
13n snow 雪
50n mist 霧
アイコンは@Kazuya_Murakami氏同様に、 ICOOON MONOから頂いたものを編集して作りました。
②各パーツの準備
各項目を表示するためのLabelを作成しフレームとの紐づけを行います。
- 日付・時刻表示用のLabelと地域表示用のLabel -> frame1
- 4行(日付、天気、気温、降水量)×7列のLabel -> frame2
- 4行(時間、天気、気温、降水量)×8列のLabel -> frame3
それぞれのLabelに初期値をセットします。
③日次の天気予報データ取得(Requests/JSON)
リクエストを実行(One Call APIへResuests)し、取得したJSONデータを辞書型で格納します。JSONデータの構成は以下の通り。
- currentのブロック
- hourlyのブロック
- dailyのブロック
<サンプル>
   }
 ],
 "daily": [
    {
     "dt": 1587952800,
     "sunrise": 1587930901,
     "sunset": 1587979463,
     "temp": {
       "day": 16.58,
       "min": 10.65,
       "max": 16.58,
       "night": 10.65,
       "eve": 14.76,
       "morn": 14.74
     },
     "feels_like": {
       "day": 13.42,
       "night": 6.31,
       "eve": 11.06,
       "morn": 11.5
     },
     "pressure": 1014,
     "humidity": 55,
     "dew_point": 7.7,
     "wind_speed": 3.68,
     "wind_deg": 93,
     "weather": [
       {
         "id": 502,
         "main": "Rain",
         "description": "強い雨",
         "icon": "10d"
       }
     ],
     "clouds": 88,
     "rain": 21.53,
     "uvi": 6.55
   },
   {
     "dt": 1588039200,
     "sunrise": 1588017234,
     "sunset": 1588065913,
            :
辞書型で格納したデータから、"daily"のブロックを特定して、その中の1件1件に対して以下の処理を行います。
- "dt"(タイムスタンプ)をもとに月(mm)、日(dd)を取得
- "weather" -> "icon"から天気コードを取得
- "temp" -> "day"から気温データを取得
- "rain"から降水量データを取得(雨が降らなければ出力されない)
④3時間毎の天気予報データ取得(Reuests/JSON)
リクエストを実行(5day/3hour Forecast APIへResuests)し、取得したJSONデータを辞書型で格納します。JSONデータの構成は以下の通り。
- listのブロック
- cityのブロック
<サンプル>
  "list": [
   {
     "dt": 1587643200,
     "main": {
       "temp": 12.93,
       "feels_like": 6.63,
       "temp_min": 12.93,
       "temp_max": 12.96,
       "pressure": 1008,
       "sea_level": 1008,
       "grnd_level": 1008,
       "humidity": 57,
       "temp_kf": -0.03
     },
     "weather": [
       {
         "id": 500,
         "main": "Rain",
         "description": "小雨",
         "icon": "10n"
       }
     ],
     "clouds": {
       "all": 52
     },
     "wind": {
       "speed": 7.29,
       "deg": 4
     },
     "rain": {
       "3h": 0.11
     },
     "sys": {
       "pod": "n"
     },
     "dt_txt": "2020-05-22 12:00:00"
   },
   {
     "dt": 1587654000,
辞書型で格納したデータから、"list"のブロックを特定して、その中の1件1件に対して以下の処理を行います。
- "dt"(タイムスタンプ)をもとに時間(hh)を取得
- "weather" -> "icon"から天気コードを取得
- "main" -> "temp"から気温データを取得
- "rain"から降水量データを取得(雨が降らなければ出力されない)
⑤各データを予め用意していたLabelにセットし画面表示
最終的に以下のような表示になりました。

ソースコード
################################
###     OpenWeatherMap     #####
################################
###
## 日付・時刻						openWeatherDt
## 地域							openWeatherPlace
## 天候アイコン(ディクショナリ)	    openWeatherIconDict
## 天気予報(日付):日次			openWeatherDailyDate
## 天気予報(天候):日次			openWeatherDailyForecast
## 天気予報(気温):日次			openWeatherDailyTemp
## 天気予報(降水量):日次			openWeatherDailyRain
## 天気予報(時間帯):3時間毎		openWeather3HourHour
## 天気予報(天候):3時間毎		    openWeather3HourForecast
## 天気予報(気温):3時間毎		    openWeather3HourTemp
## 天気予報(降水量):3時間毎		openWeather3HourRain
## 表示日付(例:2020/5/21 (Thr.))displayDate
## 表示時刻(例:15:35:56)			displayTime
## One Call API(日次)URL		openWeatherDailyUrl
## One Call APIパラメーター		openWeatherDailyUrlParams
## One Call API取得データ			forecastDailyData
## One Call API取得データ処理カウンタ	countDailyData
## Forecast API(3時間毎)URL		openWeather3HourUrl
## Forecast API パラメーター		openWeather3HourUrlParams
## Forecast API取得データ			forecast3HourData
## Forecast API取得データ処理カウンタ	count3HourData
###

## 各種パッケージのインポート
from tkinter import *
import os
import requests
import json
import math
from PIL import Image, ImageTk
import datetime

## OpenWeatherMapへのWeb APIアクセス時のパラメーター(設定値)
TZ = "Asia/Tokyo"
LAT = "35.41"
LON = "139.45"
ZIP = "135-0023,JP"
KEY = "abcdefghijklmnopqrstuvwxyz12345...."

## OpenWeatherMapへのWeb APIアクセスURL、パラメーター
openWeatherDailyUrl = "https://api.openweathermap.org/data/2.5/onecall"
openWeatherDailyUrlParams = {"lat": LAT,"lon": LON, "units":"metric","APPID": KEY}
openWeather3HourUrl = "http://api.openweathermap.org/data/2.5/forecast"
openWeather3HourUrlParams = {"zip": ZIP,"units":"metric","lang":"ja","APPID": KEY}

##################################    メイン処理    ##################################

## メインウィンドウ作成
root = Tk()

## メインウィンドウサイズ
root.geometry("1024x768")

## フレームを作成
frame1=Frame(root, bg="white")    ##日付/地域表示フレーム
frame2=Frame(root, bg="white")    ##天気予報(日次)表示フレーム
frame3=Frame(root, bg="white")    ##天気予報(3時間毎)表示フレーム

########################    日付/地域表示フレーム(frame1)    ########################

## 日付・時刻表示(frame1の1行目に表示)
openWeatherDt=Label(root, text="", bg="white", font=("", 30, "bold"))
openWeatherDt.grid(in_=frame1,row=0, column=0, sticky="news")

## 地域表示(frame1の2行目に表示)
openWeatherPlace=Label(root, text="", bg="white", fg="gray", font=("", 10, "bold"))
openWeatherPlace.grid(in_=frame1,row=1, column=0, sticky="news")


########################    天気予報(日次)表示フレーム(frame2)    ########################

## このスクリプトの絶対パス
scr_path = os.path.dirname(os.path.abspath(sys.argv[0]))

## 天候アイコン(ディクショナリ)
openWeatherIconDict={
   "01d":Image.open(scr_path + "/img/01d.png"), "01n":Image.open(scr_path + "/img/01n.png"),
   "02d":Image.open(scr_path + "/img/02d.png"), "02n":Image.open(scr_path + "/img/02n.png"),
   "03d":Image.open(scr_path + "/img/03.png"),  "03n":Image.open(scr_path + "/img/03.png"),
   "04d":Image.open(scr_path + "/img/04.png"),  "04n":Image.open(scr_path + "/img/04.png"),
   "09d":Image.open(scr_path + "/img/09.png"),  "09n":Image.open(scr_path + "/img/09.png"),
   "10d":Image.open(scr_path + "/img/10.png"),  "10n":Image.open(scr_path + "/img/10.png"),
   "11d":Image.open(scr_path + "/img/11.png"),  "11n":Image.open(scr_path + "/img/11.png"),
   "13d":Image.open(scr_path + "/img/13.png"),  "13n":Image.open(scr_path + "/img/13.png"),
   "50d":Image.open(scr_path + "/img/50.png"),  "50n":Image.open(scr_path + "/img/50.png")
}

## アイコンサイズを画面サイズにフィット(64x64)させる
for key, value in openWeatherIconDict.items():
   openWeatherIconDict[key]=openWeatherIconDict[key].resize((64, 64), Image.ANTIALIAS)
   openWeatherIconDict[key]=ImageTk.PhotoImage(openWeatherIconDict[key])

## 天気予報(日付)を配置(frame2の1行目に表示)
openWeatherDailyDate=[
   Label(root, text="X", bg="white", font=("", 20, "bold")),
   Label(root, text="X", bg="white", font=("", 20, "bold")),
   Label(root, text="X", bg="white", font=("", 20, "bold")),
   Label(root, text="X", bg="white", font=("", 20, "bold")),
   Label(root, text="X", bg="white", font=("", 20, "bold")),
   Label(root, text="X", bg="white", font=("", 20, "bold")),
   Label(root, text="X", bg="white", font=("", 20, "bold"))
]
for i in range(len(openWeatherDailyDate)):
   openWeatherDailyDate[i].grid(in_=frame2,row=0, column=i, sticky="new")

## 天気予報(天候)を配置(frame2の2行目に表示)
openWeatherDailyForecast=[
   Label(root, image=openWeatherIconDict["01d"], bg="white"),
   Label(root, image=openWeatherIconDict["01d"], bg="white"),
   Label(root, image=openWeatherIconDict["01d"], bg="white"),
   Label(root, image=openWeatherIconDict["01d"], bg="white"),
   Label(root, image=openWeatherIconDict["01d"], bg="white"),
   Label(root, image=openWeatherIconDict["01d"], bg="white"),
   Label(root, image=openWeatherIconDict["01d"], bg="white")
]
for i in range(len(openWeatherDailyForecast)):
   openWeatherDailyForecast[i].grid(in_=frame2,row=1, column=i, sticky="new")


## 天気予報(気温)を配置(frame2の3行目に表示)
openWeatherDailyTemp=[
   Label(root, text="X°C", bg="white", font=("", 16, "bold")),
   Label(root, text="X°C", bg="white", font=("", 16, "bold")),
   Label(root, text="X°C", bg="white", font=("", 16, "bold")),
   Label(root, text="X°C", bg="white", font=("", 16, "bold")),
   Label(root, text="X°C", bg="white", font=("", 16, "bold")),
   Label(root, text="X°C", bg="white", font=("", 16, "bold")),
   Label(root, text="X°C", bg="white", font=("", 16, "bold"))
]
for i in range(len(openWeatherDailyTemp)):
   openWeatherDailyTemp[i].grid(in_=frame2,row=2, column=i, sticky="new")

## 天気予報(降水量)(frame2の4行目に表示)
openWeatherDailyRain=[
   Label(root, text="Xmm", bg="white", font=("", 16, "bold")),
   Label(root, text="Xmm", bg="white", font=("", 16, "bold")),
   Label(root, text="Xmm", bg="white", font=("", 16, "bold")),
   Label(root, text="Xmm", bg="white", font=("", 16, "bold")),
   Label(root, text="Xmm", bg="white", font=("", 16, "bold")),
   Label(root, text="Xmm", bg="white", font=("", 16, "bold")),
   Label(root, text="Xmm", bg="white", font=("", 16, "bold"))
]
for i in range(len(openWeatherDailyRain)):
   openWeatherDailyRain[i].grid(in_=frame2,row=3, column=i, sticky="new")


########################    天気予報(3時間毎)表示フレーム(frame3)    ########################

## 天気予報(時間)を配置(frame3の1行目に表示)
openWeather3HourHour=[
  Label(root, text="X", bg="white", font=("", 20, "bold")),
  Label(root, text="X", bg="white", font=("", 20, "bold")),
  Label(root, text="X", bg="white", font=("", 20, "bold")),
  Label(root, text="X", bg="white", font=("", 20, "bold")),
  Label(root, text="X", bg="white", font=("", 20, "bold")),
  Label(root, text="X", bg="white", font=("", 20, "bold")),
  Label(root, text="X", bg="white", font=("", 20, "bold")),
  Label(root, text="X", bg="white", font=("", 20, "bold"))
]
for i in range(len(openWeather3HourHour)):
   openWeather3HourHour[i].grid(in_=frame3,row=0, column=i, sticky="news")

## 天気予報(天候)を配置(frame3の2行目に表示)
openWeather3HourForecast=[
   Label(root, image=openWeatherIconDict["01d"], bg="white"),
   Label(root, image=openWeatherIconDict["01d"], bg="white"),
   Label(root, image=openWeatherIconDict["01d"], bg="white"),
   Label(root, image=openWeatherIconDict["01d"], bg="white"),
   Label(root, image=openWeatherIconDict["01d"], bg="white"),
   Label(root, image=openWeatherIconDict["01d"], bg="white"),
   Label(root, image=openWeatherIconDict["01d"], bg="white"),
   Label(root, image=openWeatherIconDict["01d"], bg="white")
]
for i in range(len(openWeather3HourForecast)):
   openWeather3HourForecast[i].grid(in_=frame3,row=1, column=i, sticky="news")

## 天気予報(気温)を配置(frame3の3行目に表示)
openWeather3HourTemp=[
   Label(root, text="X°C", bg="white", font=("", 16, "bold")),
   Label(root, text="X°C", bg="white", font=("", 16, "bold")),
   Label(root, text="X°C", bg="white", font=("", 16, "bold")),
   Label(root, text="X°C", bg="white", font=("", 16, "bold")),
   Label(root, text="X°C", bg="white", font=("", 16, "bold")),
   Label(root, text="X°C", bg="white", font=("", 16, "bold")),
   Label(root, text="X°C", bg="white", font=("", 16, "bold")),
   Label(root, text="X°C", bg="white", font=("", 16, "bold"))
]
for i in range(len(openWeather3HourTemp)):
   openWeather3HourTemp[i].grid(in_=frame3,row=2, column=i, sticky="news")

## 天気予報(降水量)を配置(frame3の4行目に表示)
openWeather3HourRain=[
   Label(root, text="Xmm", bg="white", font=("", 16, "bold")),
   Label(root, text="Xmm", bg="white", font=("", 16, "bold")),
   Label(root, text="Xmm", bg="white", font=("", 16, "bold")),
   Label(root, text="Xmm", bg="white", font=("", 16, "bold")),
   Label(root, text="Xmm", bg="white", font=("", 16, "bold")),
   Label(root, text="Xmm", bg="white", font=("", 16, "bold")),
   Label(root, text="Xmm", bg="white", font=("", 16, "bold")),
   Label(root, text="Xmm", bg="white", font=("", 16, "bold"))
]
for i in range(len(openWeather3HourRain)):
   openWeather3HourRain[i].grid(in_=frame3,row=3, column=i, sticky="news")

## ジオメトリマネージャーで各項目を表示
frame1.pack(fill='both',expand=True)
frame2.pack(fill='both',expand=True)
frame3.pack(fill='both',expand=True)

## レイアウト調整(横幅を画面に合わせる)
frame1.columnconfigure(0, weight=1)  ##frame1は1項目なので引数は0

for i in range(len(openWeatherDailyDate)):   ##frame2は7項目なので0~6を順番に実行
   frame2.columnconfigure(i, weight=1)

for i in range(len(openWeather3HourHour)):   ##frame3は8項目なので0~7を順番に実行
   frame3.columnconfigure(i, weight=1)

## メインウィンドウを閉じる
def wm_close():
   root.destroy()

## Closeボタン(X)
btn=Button(root, text=" X ", font=('', 16), relief=FLAT, command=wm_close)

# 画面がリサイズされたとき
def change_size(event):
   # ボタンの位置を右上に
   btn.place(x=root.winfo_width() - 60, y=14)

# 画面のリサイズをバインドする
root.bind('<Configure>', change_size)

# メインウィンドウの最大化、最前面表示
root.attributes("-fullscreen", "1")
root.attributes("-topmost", True)

########################    日時データ取得/更新    ########################

def updateTime():
   # 現在日時を表示
   now=datetime.datetime.now()
   displayDate="{0:0>4d}/{1:0>2d}/{2:0>2d} ({3}.)".format(now.year, now.month, now.day, now.strftime("%a"))
   displayTime="{0:0>2d}:{1:0>2d}:{2:0>2d}".format(now.hour, now.minute, now.second)
   openWeatherDt.configure(text=displayDate+displayTime)

   # 地域情報を表示
   openWeatherPlace.configure(text=TZ + " ( lat: " + LAT + " , lon: " + LON + " ) ")

   # 1秒間隔でUpdate
   root.after(1000, updateTime)

########################    天気予報(日次)データ取得/更新    ########################

def updateDailyWeather():
   # 表示カウンタ
   countDailyData=0

   # OpenWeatherMap に問い合わせを行う
   response=requests.get(openWeatherDailyUrl,params=openWeatherDailyUrlParams)
   forecastDailyData=json.loads(response.text)

   # 結果が得られない場合は即時終了
   if not ("daily" in forecastDailyData):
       print("error")
       return

   # 結果を 1日単位で取得
   for item in forecastDailyData["daily"]:
       # 日付を表示(mm/dd)
       openWeatherDailyDate[countDailyData].configure(text=str(datetime.datetime.fromtimestamp(item["dt"]).month) + "/" + str(datetime.datetime.fromtimestamp(item["dt"]).day))

       # 気候をアイコンで表示
       openWeatherDailyForecast[countDailyData].configure(image=openWeatherIconDict[item["weather"][0]["icon"]])

       # 気温を表示
       openWeatherDailyTemp[countDailyData].configure(text="{0}°c".format(round(item["temp"]["day"])))

       # 降水量を表示
       rainfall = 0
       if "rain" in item:
           rainfall = item["rain"]
       openWeatherDailyRain[countDailyData].configure(text="{0}mm".format(math.ceil(rainfall)))

       # 表示カウンタを更新
       countDailyData += 1

       # 全て表示し終えたらループ終了
       if countDailyData >= len(openWeatherDailyDate):

           # 60 秒間隔で繰り返す
           root.after(60000, updateDailyWeather)

           return


########################    天気予報(3時間毎)データ取得/更新    ########################

def update3hourWeather():

   # 表示カウンタ
   count3HourData=0

   # OpenWeatherMap に問い合わせを行う
   response=requests.get(openWeather3HourUrl,params=openWeather3HourUrlParams)
   forecast3HourData=json.loads(response.text)

   # 結果が得られない場合は即時終了
   if not ("list" in forecast3HourData):
       print("error")
       return

   # 結果を 3 時間単位で取得
   for item in forecast3HourData["list"]:
       # 時間帯を 24 時間表記で表示
       openWeather3HourHour[count3HourData].configure(text=datetime.datetime.fromtimestamp(item["dt"]).hour)

       # 気候をアイコンで表示
       openWeather3HourForecast[count3HourData].configure(image=openWeatherIconDict[item["weather"][0]["icon"]])

       # 気温を表示
       openWeather3HourTemp[count3HourData].configure(text="{0}°c".format(round(item["main"]["temp"])))

       # 降水量を表示
       rainfall = 0
       if "rain" in item and "3h" in item["rain"]:
       	rainfall = item["rain"]["3h"]
       openWeather3HourRain[count3HourData].configure(text="{0}mm".format(math.ceil(rainfall)))

       # 表示カウンタを更新
       count3HourData += 1

       # 全て表示し終えたらループ終了
       if count3HourData >= len(openWeather3HourHour):

           # 60 秒間隔で繰り返す
           root.after(60000, update3hourWeather)

           return


# 初回起動
updateTime()
updateDailyWeather()
update3hourWeather()

# コールバック関数を登録
root.after(1000,  updateTime)
root.after(60000, updateDailyWeather)
root.after(60000, update3hourWeather)

# メインループ
root.mainloop()
<関連記事>
Strava/Withings Web API開発(天気と走行距離と体重をダッシュボードで表示してみた)
https://note.com/sanoatsu/n/nbe00ce35d3b1
Strava/Withings Web API開発 - 全体概要
https://note.com/sanoatsu/n/ncc074b9ce5f7
Strava/Withings Web API開発 - 準備編①
https://note.com/sanoatsu/n/n0104f85631cf
Strava/Withings Web API開発 - 準備編②
https://note.com/sanoatsu/n/n4d05a6f1cb2d
Strava/Withings Web API開発 - 準備編③
https://note.com/sanoatsu/n/nb60129601d54
Strava/Withings Web API開発 - Pythonリファレンス
Web API認証
https://note.com/sanoatsu/n/n98742c974b17
GUIレイアウト作成:Tkinter
https://note.com/sanoatsu/n/ncb830ae933dd/
日付・時刻処理:datetime
https://note.com/sanoatsu/n/n050ca16df6c7/
HTTPでのデータ取得:Requests
https://note.com/sanoatsu/n/n75e81bc2896a
データ格納:JSONと配列、辞書
https://note.com/sanoatsu/n/na76312571869/
よろしければサポートお願いします。