Angular と leaflet (OpenStreet Map) で Geo Tracker を作る

Angular で leaflet を使う という記事で Angularから leaflet(OpenStreet Map) を使う方法をまとめました。
今回は Geolocation API を利用して定期的に現在位置を leaflet の地図上にマッピングしていく Geo Tracker を作成してみます。
Leaflet で 位置情報のトラッキング
Geolocation API を利用することでブラウザだけで現在位置のトラッカーが簡単に作れます。
この記事に使っているソースコードは Github で公開しています。
Leaflet のインストール
leaflet のインストールについては Angular で leaflet を使う を参考にしてください。
Geolocation API
angular service から watchPosition という Geolocatopn API を利用しており、位置に変化があるとその変更後の位置情報を subscribe して取得できるようにします。
import { Injectable } from '@angular/core';
import { Observable } from 'rxjs';

@Injectable({
 providedIn: 'root'
})

export class GeolocationService {
 positionOptions: PositionOptions = {
   enableHighAccuracy: true,
   maximumAge: 0, // キャッシュは行わない
   timeout: 100000 // ミリ秒でタイムアウト値を指定する。結構取れないので長めにする。
 };

 constructor() { }

 // https://github.com/angular/angular/issues/27597
 createWatchPosition(): Observable<Position> {
   return new Observable((observer) => {
     let watchId;

     const onSuccess: PositionCallback = (pos: Position) => {
       observer.next(pos);
     };

     const onError: PositionErrorCallback | any = (error) => {
       observer.error(error);
     };

     if ('geolocation' in navigator) {
       watchId = navigator.geolocation.watchPosition(onSuccess, onError, this.positionOptions);
     } else {
       onError('Geolocation not available');
     }

     return { unsubscribe() { navigator.geolocation.clearWatch(watchId); } };
   });
 }

}
component から subscribe するわけですが debounceTime(1000) を設定して、データ通信頻度を調整しています。
subscribe しているので OnDestroy から unsubscribeしています。
import { Component, OnInit, OnDestroy, AfterViewInit, ViewChild, ElementRef } from '@angular/core';
import { GeolocationService } from '../services/geolocation.service';
import { debounceTime } from 'rxjs/operators';
import * as L from 'leaflet';
~省略~
export class GeolocationComponent implements OnInit, AfterViewInit, OnDestroy {
map: any;
constructor(
private geolocationService: GeolocationService,
) { }
// ngOnInit を利用すると <div id="map"></div> が描画される前に map を参照してエラーになる場合がある
ngAfterViewInit() {
this.subscribeGeolocation();
}
// OnDestroy しないとページ遷移してもsubscribeしてしまうので必要なければDestroyした方が良い
ngOnDestroy() {
if (this.locationsSubscription) {
this.locationsSubscription.unsubscribe();
}
}
subscribeGeolocation() {
this.locationsSubscription = this.geolocationService.createWatchPosition()
.pipe(
// debounceTimeを設定してデータ量を節約している
debounceTime(1000)
).subscribe(
(value: Position) => {
// value.coords の中に緯度経度とタイムスタンプが返ってくる
this.geoLocation = {} as GeoLocations;
this.geoLocation.lat = value.coords.latitude;
this.geoLocation.lon = value.coords.longitude;
this.geoLocation.timestamp = value.timestamp;
// geoLocationArray に位置情報を格納する。見やすさを考慮して直近10点だけを利用する。
if (this.geoLocationArray.length < 10) {
this.geoLocationArray.push(this.geoLocation);
} else {
this.geoLocationArray.shift();
this.geoLocationArray.push(this.geoLocation);
}
if (!this.initialize) {
this.initMap(this.geoLocation.lat, this.geoLocation.lon);
}
this.setMaker();
},
error => {
console.log('error:', error);
}
);
}
// 地図を初期化
initMap(lat: number, lon: number) {
this.map = L.map('map').setView([lat, lon], 13);
L.tileLayer('https://{s}.tile.openstreetmap.org/{z}/{x}/{y}.png', {
attribution: '© <a href="https://www.openstreetmap.org/copyright">OpenStreetMap</a> contributors'
}).addTo(this.map);
this.initialize = true;
}
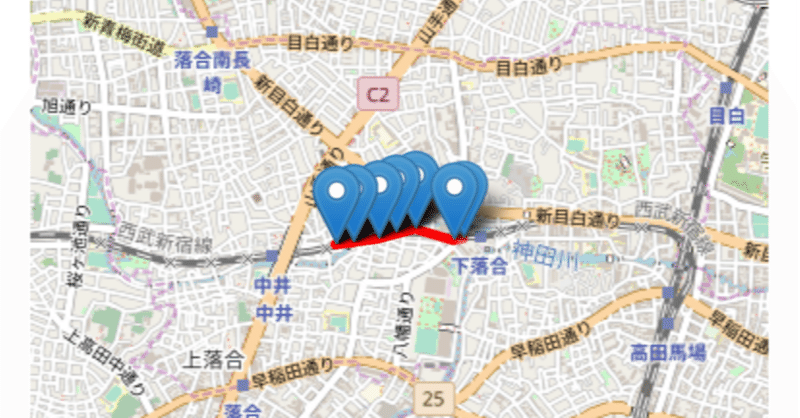
// マーカーをプロットしpolylineでつなぐ
setMaker() {
const polylineArray = [];
if (this.geoLocationArray) {
for (let i = 0; this.geoLocationArray.length > i; i++ ) {
const date = new Date(this.geoLocationArray[i].timestamp);
L.marker(
[this.geoLocationArray[i].lat, this.geoLocationArray[i].lon]
).bindPopup(
'<b>Hello!!</b><br> ' + (date.getMonth() + 1) + '/' + date.getDate()
).addTo(this.map);
this.map.flyTo([this.geoLocationArray[i].lat, this.geoLocationArray[i].lon], 14, { duration: 2 });
polylineArray.push( [this.geoLocationArray[i].lat, this.geoLocationArray[i].lon]);
L.polyline([polylineArray], {color: '#FF0000', weight: 5, opacity: 0.6})
.addTo(this.map);
}
}
}あとは html で描画するだけです。
<div class="map" #map id="map" style="width: 100%; height: 532.2px;"></div>以上
この記事が気に入ったらサポートをしてみませんか?