中国情勢を衛星で分析(2021/06/03) あと、象が北上した理由

中国の動き
この項では、毎日、中国の動きを衛星画像分析で追跡しています。経済活動のリアルタイム同行は夜間光、治水状況は土壌水分(Soil Moisture) 、植物育成状況は、Soil Moisture Active/Passive Missionの光合成有効放射割合 画像から分析しています。
【1.経済状態】
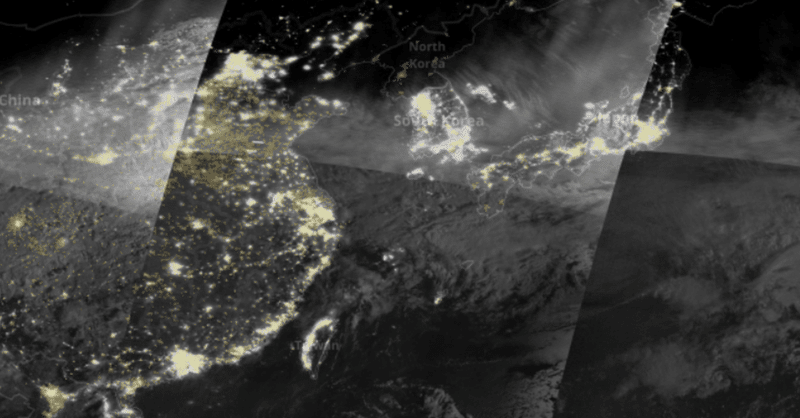
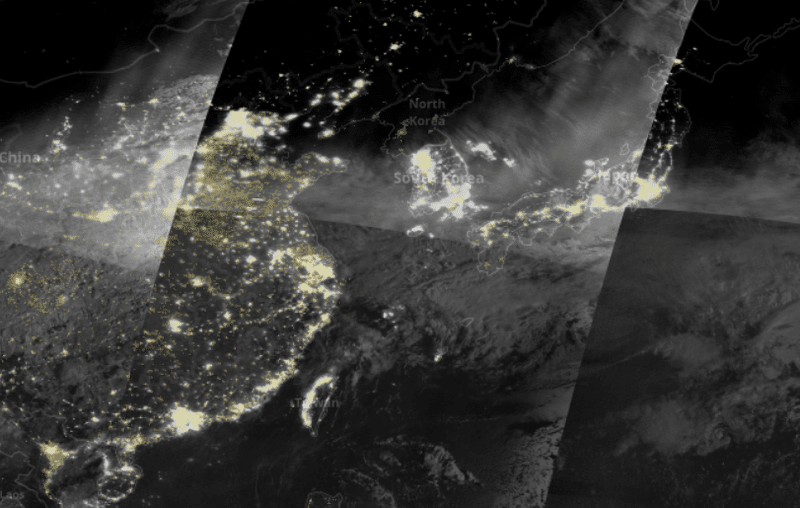
国家としての経済活動は、夜間光画像から解析できます。
コロナ前(2019/06/02)
東北部と南部を中心に、光量=経済活動が落ちている様子が分かります。
2.食料生産
緑:食糧生産可能地域
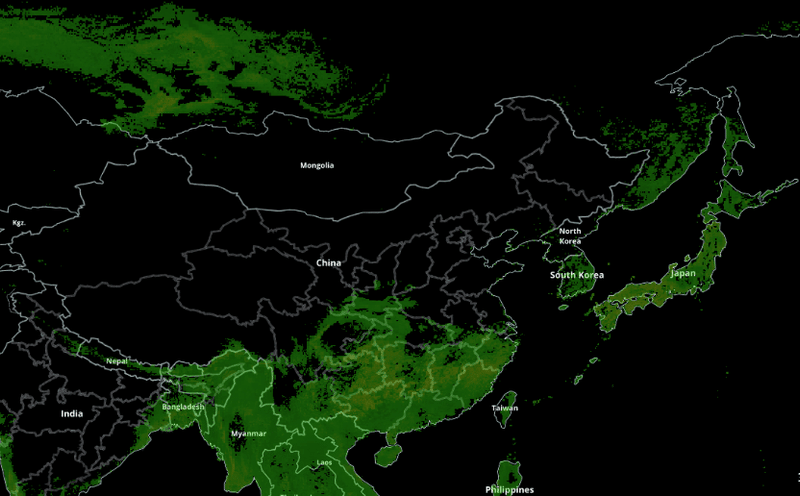
コロナ前(2019/05/24)
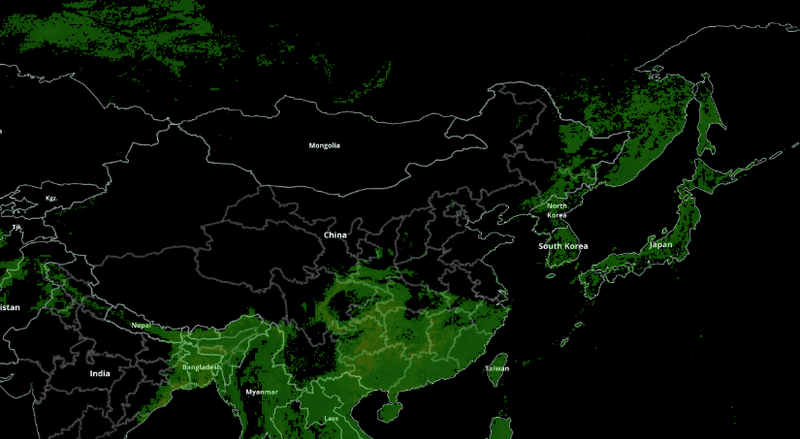
東北部が消えていることが分かります。
あと、雲南省が2019年は緑がなかったのに、2021年は緑でおおわれています。これが象が北上した理由です。
中国でゾウの群れが謎の北進 環境の変化?道迷い?
https://www.asahi.com/articles/ASP5Y44MYP5YUHBI00N.html
NASA@(2021/06/02)
Population Density
2020 layer is from the Gridded Population of the World, Version 4 (GPWv4) Population Count Adjusted to Match 2015 Revision of UN WPP Country Totals.
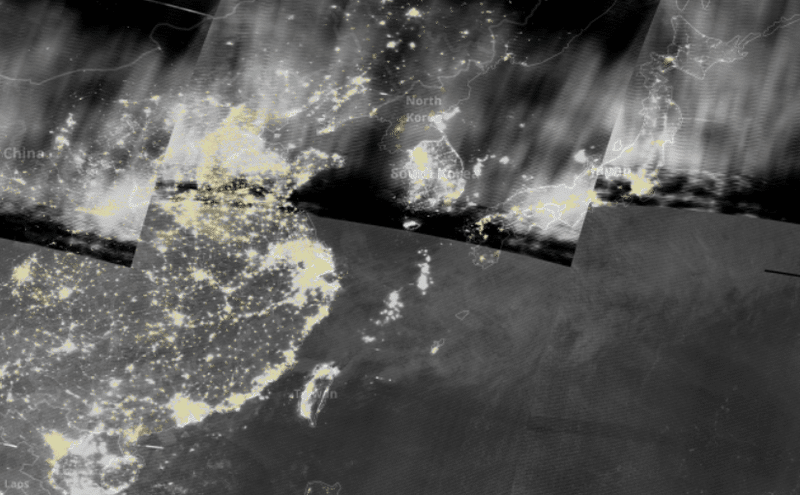
Nighttime Imagery
(Day/Night Band, Enhanced Near Constant Contrast) layer shows the Earth’s surface and atmosphere using a sensor designed to capture low-light emission sources, under varying illumination conditions.
Soil Moisture
Single Channel Algorithm (Day) layer indicates the amount of soil moisture over land masses in grams per cubic centimeters (g/cm3). This layer was constructed by using the Single Channel Algorithm (SCA) using resampled brightness temperature data
The Soil Moisture Active Passive (SMAP)(2021/05/24)
“Percent of Potential Vegetation Light Use Efficiency (L4, 9 km Grid Cell Mean, Model Value-Added)” layer displays model-derived global daily average estimated percent of bulk environmental constraint to Photosynthetically Active Radiation (PAR) conversion efficiency and vegetation productivity posted on a 9 km
追記:書いている理由
なお、台湾有事(人民解放軍の台湾進攻作戦)の話題がよく聞かれますが、
中国が台湾と北朝鮮で同時に問題が起きた場合、中国が優先するのは“地続き”の北朝鮮です。
(別途、記述予定)
https://ja.wikipedia.org/wiki/%E5%8F%A4%E5%AF%A7%E9%A0%AD%E6%88%A6%E5%BD%B9
中国に対してOSINT を行っている理由は、毎日のビジネスで使うためはもちろんですが、後日に参照できるよう、リアルタイムに今起きていることを可視化して歴史に残すためです。
#写真 #中国 #習近平 #海外 #毎日note #文藝春秋イラストデビュー #noteのつづけ方
よろしければサポートよろしくお願いします。いただいたサポートは、日中韓とアメリカのリアルタイム感情分析を進めるために使わせていただきます