RSI式ストラテジー(ロングのみ)【TradingView】

スクリプトの説明
RSIの移動平均線が指定した値を超えると”買い”でエントリーして、
RSIの移動平均線が指定した値に達したら”売る”というシステムです。
(ストラテジーは模擬トレードなので、このスクリプトで実際にシステムトレードができるわけではありません)
実装方法
https://youtu.be/-NFE0xZ4J14
この動画の(2:21~)で説明しています。
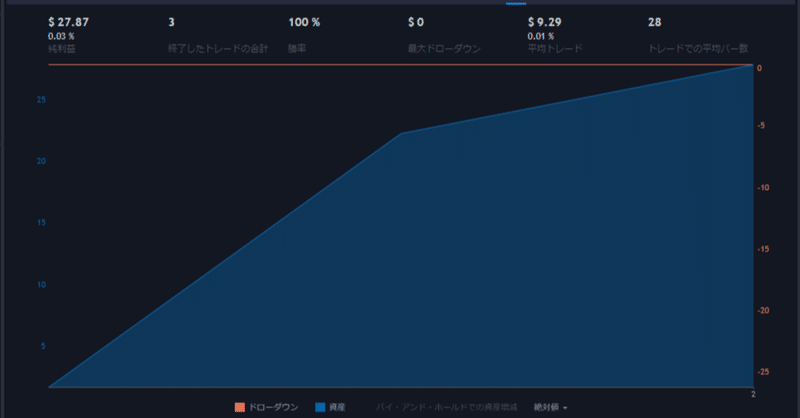
使用例
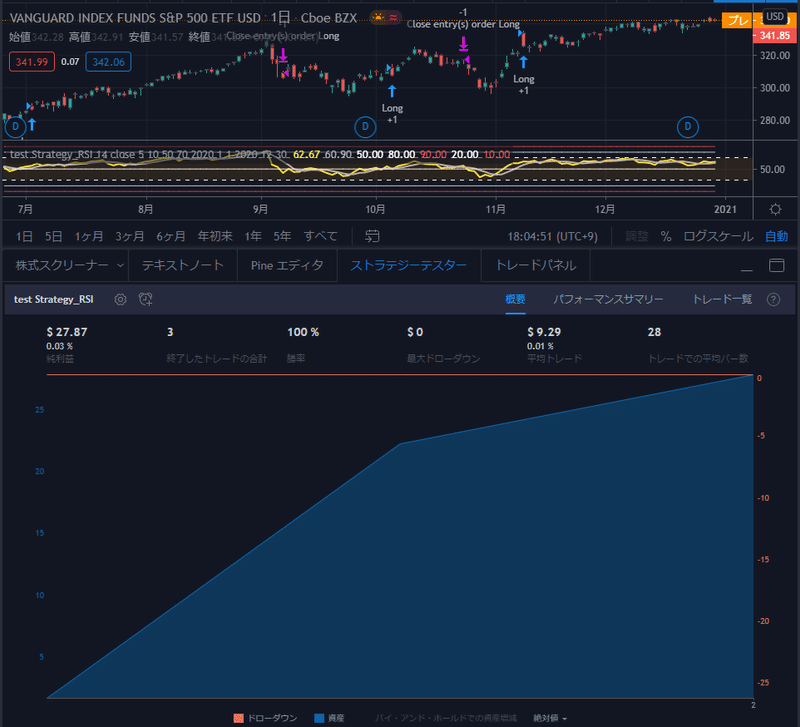
注意!!
スクリプトの利用は自己責任でお願い致します。
何かしらの不備があった場合も責任は負いかねますので、
使用の際にはスクリプトの確認をお願い致します。
//@version=4
strategy(title = "test Strategy_RSI")

//ロングのみ
strategy.risk.allow_entry_in(strategy.direction.long)

//入力
len = input(defval = 14, title = "Length", minval = 1) //RSIの期間
src = input(close, "Source", type = input.source) //RSIの入力値
sgl = input(defval = 5, title = "Signal", minval = 1) //RSI移動平均線の期間
tsd = input(defval = 10, title = "Trail Stop", minval = 3, maxval = 200, step = 1) //トレイルストップの期間
ety = input(defval = 50, title = "entry point(RSI)", minval = 0, maxval = 100) //買う時のRSI値
sel = input(defval = 70, title = "sell point(RSI)", minval = 0, maxval = 100) //売る時のRSI値

//RSIの計算式
up = rma(max(change(src), 0), len)
down = rma(-min(change(src), 0), len)
rsi = down == 0 ? 100 : up == 0 ? 0 : 100 - (100 / (1 + up / down))

//RSIを表示
plot(rsi, "RSI", color=color.yellow, linewidth=2)

//RSIの移動平均線
rsima = sma(rsi,sgl)
plot(rsima, "Signal", color=color.silver, linewidth=2)

//描画表示
band0 = hline(30, title="Lower Band", color=color.white, linestyle=hline.style_dashed, linewidth=1) //水平線30
band1 = hline(70, title="Upper Band", color=color.white, linestyle=hline.style_dashed, linewidth=1) //水平線70
line0 = plot(50, title="Middle Band", color=color.white, linewidth=1, transp=5) //水平線50
line1 = plot(80, title="Upper Upper Band", color=color.white, linewidth=1, transp=25) //水平線80
line2 = plot(90, title="Upper Upper Upper Band", color=color.red, linewidth=1, transp=25) //水平線90
line3 = plot(20, title="Lower Lower Band", color=color.white, linewidth=1, transp=25) //水平線20
line4 = plot(10, title="Lower Lower Lower Band", color=color.red, linewidth=1, transp=25) //水平線10
fill(band1, band0, color=color.orange, transp=90, title="Background") //背景

//対象期間
strpy = input(defval = 2020, title = "Start time(year)", minval = 1)
strpm = input(defval = 1, title = "Start time(month)", minval = 1)
strpd = input(defval = 1, title = "Start time(day)", minval = 1)
endpy = input(defval = 2020, title = "End time(year)", minval = 1)
endpm = input(defval = 12, title = "End time(month)", minval = 1)
endpd = input(defval = 30, title = "End time(day)", minval = 1)

//開始日時計算
test_start = timestamp(strpy, strpm, strpd, 00, 00)

//終了日時計算
test_end   = timestamp(endpy, endpm, endpd, 00, 00)

//テスト期間の指定
is_test = test_start <= time and  time <= test_end

// 最安値を求める(トレイルストップ)
Lowest(tsd) => ser = lowest(low, tsd)
lowest = Lowest(tsd)

//売買条件
longCondition = crossover(rsima, ety)
sellCondition = crossunder(rsima, sel) or (low == lowest)


//ストラテジー
strategy.entry(id = "Long", long = strategy.long, when = longCondition and is_test)
strategy.close(id = "Long", when = sellCondition and is_test)
使い方
まず以下の設定をする。
基本的にはデフォルトの値から変えなくていいのでノータッチ。
【設定】
RSIの期間(デフォルト:14)
RSI移動平均線の期間(デフォルト:5)
トレイルストップの期間(デフォルト:10)
RSI移動平均線の買いポイント(デフォルト:50)
RSI移動平均線の売りポイント(デフォルト:70)
【初期設定での挙動】
RSIの5日移動平均線が50%を上抜けしたら”買い”でエントリーして、70%に達したら売るというもの。
トレイルストップにより過去10日間の最安値を更新したときに損切り。
この記事が気に入ったらサポートをしてみませんか?